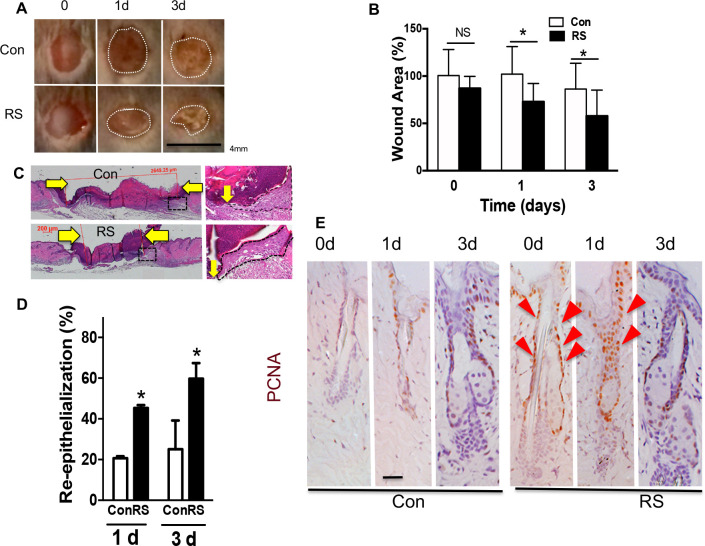
Fig 5. TGFβ inhibitor RS accelerates wound re-epithelialization.
(A) Photographs of skin wounds at 0d, 1d, and 3d after 3mm biopsy was excised from RS pretreated or control skin. Bar = 4mm. Variation in 2 wounds and 3 mice are in Fig S4A Fig. (B) Quantitated wound size (mean +/- SD *p<0.05, 2 sections per mouse, 3 mice each group). (C) H&E staining of skin wounds (3d) with enlarged images (right). Yellow arrows show wound edges. (D) Re-epithelialization rate at 1d and 3d (mean +/- SD, n = 6, *p<0.05) that is calculated by the ratio of the distance between the wounding edges of the epithelial tongues to the original diameter of the wound. (E) Cell proliferation at wound edges. PCNA staining (brown) with blue counterstaining. Red triangles show brown PCNA positive cells increased in RS treated wounds. Bars = 50 um. Representative images of reproduced results are shown.

