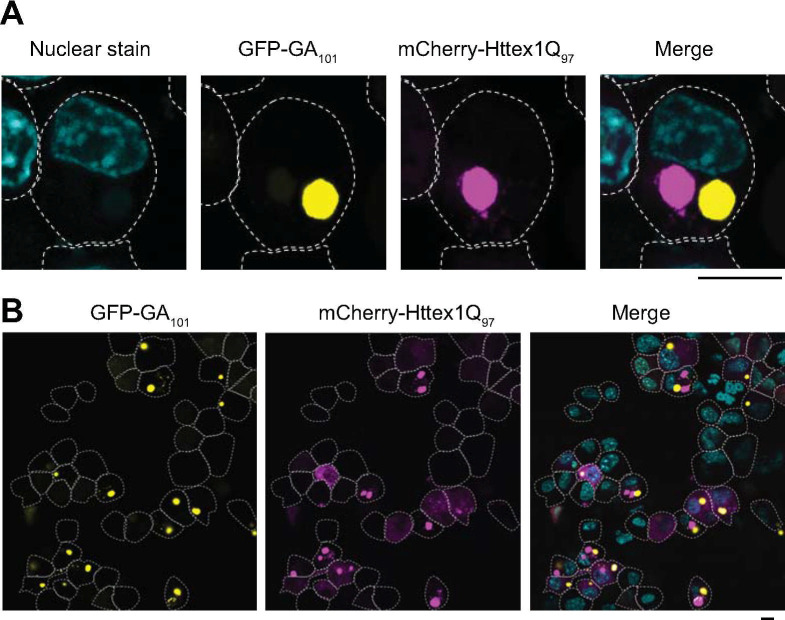
Fig 1. Httex1Q97 and polyGA101 form distinct inclusions in neuro2a cells.
Confocal micrographs of neuro2a cells co-expressing GFP-tagged GA101 (yellow) and mCherry-tagged Httex1Q97 (magenta), fixed 24 hr post-transfection and stained with Hoechst33258 (cyan) to visualize nuclei. The dotted white lines show the outlines of cells (manually traced). Scale bar represents 5 μm. Panels A and B show two different scales of view.

