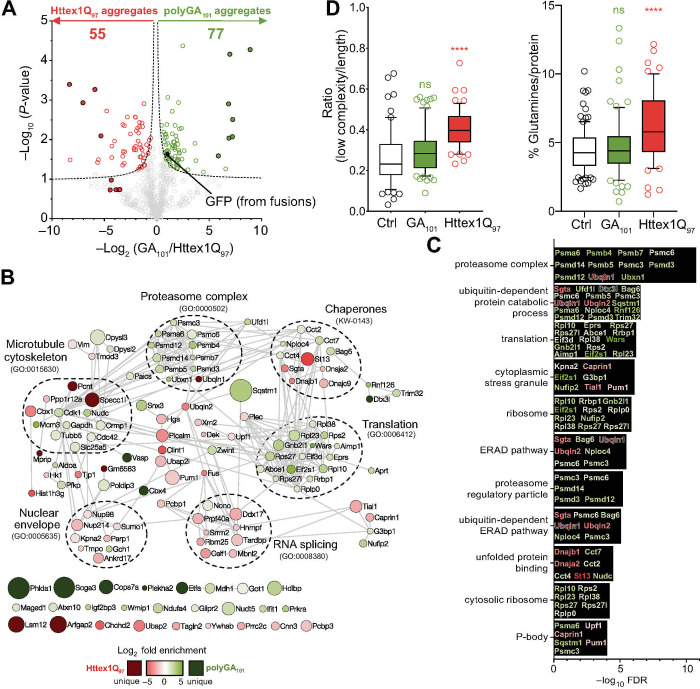
Fig 2. Proteome recruitment patterns to polyGA101 and Httex1Q97 inclusions.
A. Volcano plot of proteins identified in the inclusions. P-values were calculated by a two-sided one samples t-test with null hypothesis that abundances were unchanged and the log2 ratio was equal to 0. Proteins meeting stringency thresholds (hyperbolic curves, FDR≤0.05, S0 = 0.1) are shown as colored empty circles and proteins unique to each aggregate type are shown as filled colored circles. B. STRING interaction maps (v.11) determined in Cytoscape (v3.7) for proteins significantly enriched in the inclusions (the full list of proteins is in S2 Table). The analysis was done at the highest confidence setting (0.9). Each protein was represented by a colored circle sized proportionally to–log10 (P-value). The color scale represents logarithm of fold change. Selected significantly enriched GO terms (GOCC, GOPB, and UniProt keywords) are displayed (Full terms are shown in S3 Table). Note the proteins shown without connections at the bottom are those that are seen in the dataset but which do not have known protein interactions with the other proteins shown. C. The 10 most significantly enriched GO terms (from S3 Table) with proteins identified in the GO terms colour coded to enrichment (as per panel 2B). D. Analysis of enriched proteomes for low-complexity regions (IUPred-L) and high glutamine content. Significance of difference was assessed against a control dataset of random mouse proteins (S1 Table) with the Mann-Whitney-Wilcoxon test. Whiskers extend from 10 to 90%.

