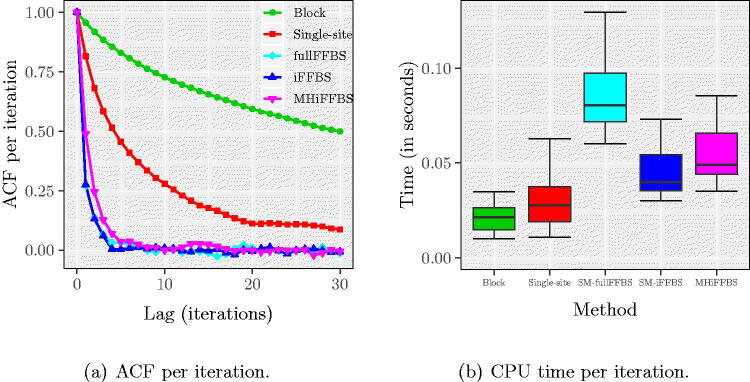
Fig. 3.
(a) Autocorrelation function of TIP and (b) CPU time per iteration for the Markov epidemic model. ACF plots in the left panel are the average across 200 replicates. Quantiles in the right panel are obtained from the same 200 runs. These plots show that the fullFFBS, iFFBS, and MHiFFBS methods have very good mixing properties but are more computationally expensive than the remaining methods.

