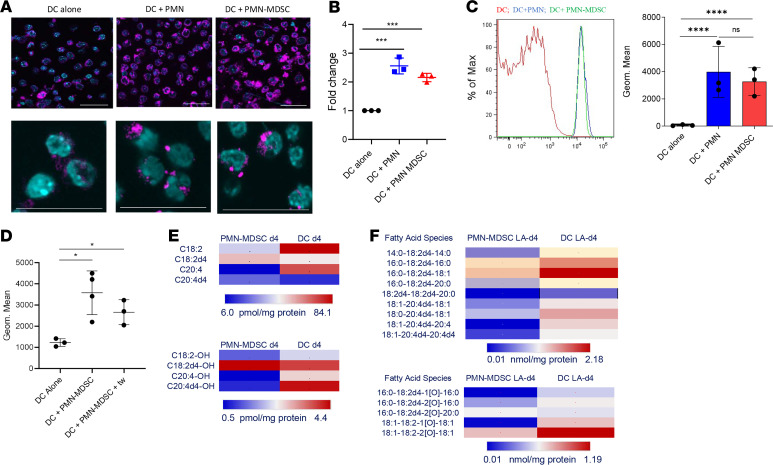
Figure 2. Lipid transfer from PMN-MDSC to DCs.
(A) Confocal image of lipid bodies (LB) using BODIPY in cDC1 after coculture with PMN or PMN-MDSC. Scale bar: 50 μm. (B) Flow cytometric analysis of lipid content in cDC1 stained with BODIPY after coculture with PMN and PMN-MDSC, expressed as fold change to the geometric mean of Bodipy expression in DCs alone (n = 3). (C) Flow cytometric analysis of lipid transfer from PMN-MDSC to cDC1 after coculture with BODIPY-labeled PMN and PMN-MDSC. Left: representative example of staining. Right: cumulative results of the experiments (n = 3). (D) Flow cytometric analysis of lipid content in cDC1 stained with BODIPY after coculture with PMN-MDSC with or without Transwell system (n = 3). (E) Heatmap showing the content of nonoxidized fatty acids LA, LA-d4, AA, and AA-d4 elongated from LA-d4 (top) and their monooxygenated species (bottom) in PMN-MDSC and DCs after coculture of DCs with PMN-MDSC LA-d4. (F) Heatmap showing the content of nonoxidized TAG molecular species containing LA-d4 and elongated AAd4 (top) and their oxygenated species (bottom) in PMN-MDSC and DCs after coculture of DCs with PMN-MDSC LA-d4. (B–D) In all experiments, mean ± SD is shown. *P < 0.05, ***P < 0.001, ****P < 0.0001, ANOVA test with corrections for multiple comparisons.

