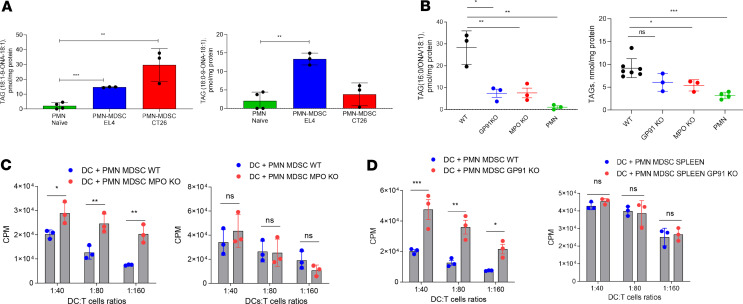
Figure 3. MPO and NADPH oxidase in PMN-MDSC affect cross-presentation by CD103+ DCs.
(A) Content of oxidatively truncated TAG molecular species in PMN-MDSC from indicated tumor-bearing and PMN from tumor-free mice (n = 3). ONA, 9-oxononanoic acid. (B) Content of oxidatively truncated TAG molecular species (left) and total TAGs (right) in PMN-MDSC isolated from spleens of EL4 tumor-bearing WT, GP91-KO, and MPO-KO mice and PMN from tumor-free mice. Please note 1000-fold difference in the scales between left and right graphs in B. (n = 3). (C) Proliferation of OT1 CD8+ T cells after stimulation with CD103+ DCs after coculture with WT PMN-MDSC or MPO-KO PMN-MDSC and loading with OVA-derived long peptides (left) or OVA-derived short peptide (right) (n = 3, each experiment has been performed in triplicate). (D) Proliferation of OT1 CD8+ T cells after stimulation with CD103+ DCs after coculture with WT PMN-MDSC or GP91-KO PMN-MDSC and loading with OVA-derived long peptides (left) or OVA-derived short peptide (right) (n = 3, each experiment has been performed in triplicate). (C and D) Representative experiments are shown. Proliferation was measured by 3[H]-thymidine uptake in triplicates. In all experiments, mean ± SD is shown. (A and B) *P < 0.05, **P < 0.01, ***P < 0.001, 2-sided Student’s t test and ANOVA with correction for multiple comparisons. (C and D) *P < 0.05, **P < 0.01, ***P < 0.001, 2-sided Student’s t test.

