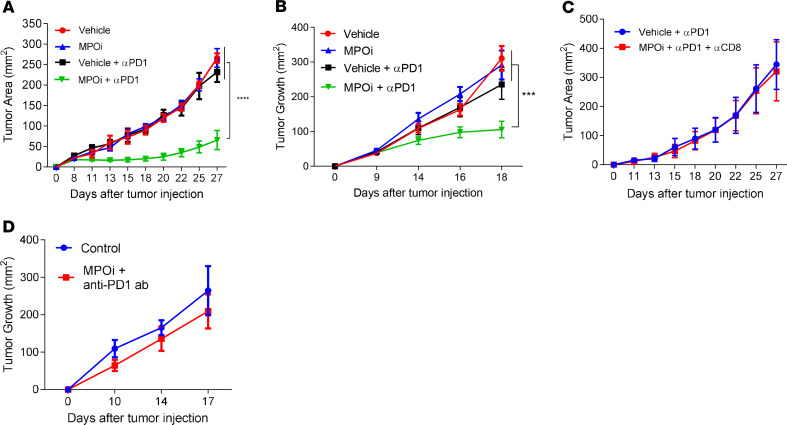
Figure 5. Effect of pharmacological inhibition of MPO on tumor growth.
(A) Tumor growth in LLC TB mice, treated with anti-PD1 and MPO inhibitor (each group n = 5). (B) Tumor growth in B16F10 TB mice, treated with anti-PD1 and MPO inhibitor (each group n = 8). (C) Tumor growth in LLC-bearing mice depleted of CD8+ T cells and treated with anti-PD1 and MPO inhibitor (each group n = 4). (D) Tumor growth in LLC-bearing BATF3-KO mice, treated with anti-PD1 and MPO inhibitor (each group n = 4). Mean ± SEM is shown. ***P < 0.001, ****P < 0.0001, 2-way ANOVA with corrections for multiple comparison.

