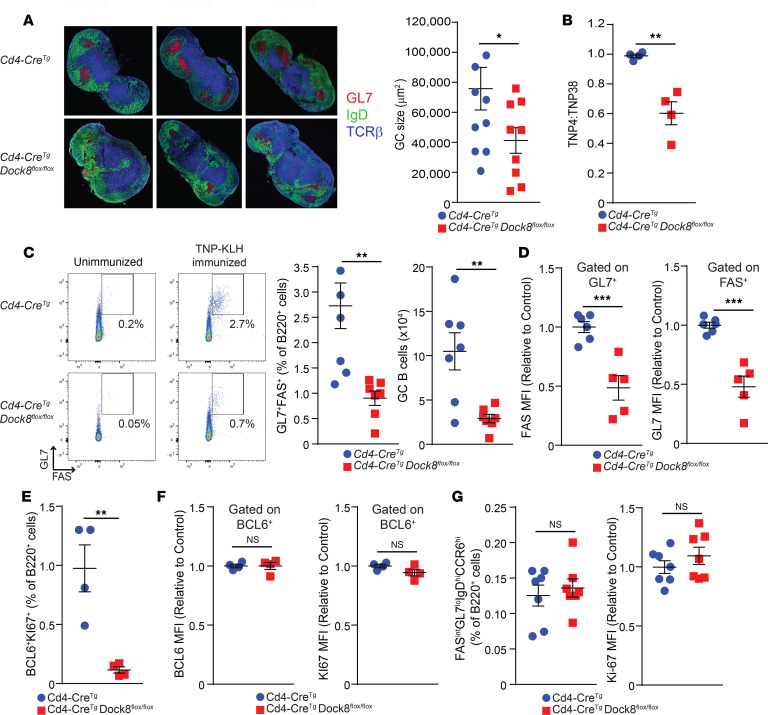
Figure 2. Cd4-CreTgDock8fl/fl mice have a marked reduction in GC B cells after immunization with TD antigen.
Draining LNs from Cd4-CreTgDock8fl/fl and control mice immunized in the hocks with TNP-KLH were examined on day 2 for pre-GC B cells, on day 7 for GC B cells, and on day 10 for GC size. (A) Representative immunofluorescence photomicrograph of popliteal LNs (left). B cell follicles (IgD+) are in green, GCs (GL7+) in red, and the T cell zones (TCRβ+) in blue. Images are at ×20 magnification. Quantification of GC size (right). n = 4–5 mice/group in 2 pooled independent experiments. ANOVA; *P < 0.05. (B) TNP-specific IgG affinity determined on day 14 after immunization. n = 4 mice/group. Results are representative of 2 independent experiments. (C) Representative flow cytometry plots, and percentages and numbers of FAS+GL7+ GC B cells in draining LNs. n = 7 mice/group. (D) MFI of surface FAS and GL7 by B220+GL7+ and B220+FAS+ cells, respectively. n = 5–6 mice/group. (E) Percentages of BCL6+KI-67+ B cells in draining LNs. n = 4 mice/group. (F) MFI of BCL6 and KI-67 (right) in BCL6+ B cells. n = 4 mice/group. (G) Percentage of FASintGL7loIgDhiCCR6hi pre-GC B cells and MFI of KI-67 in pre-GC B cells. n = 7 mice/group from 2 pooled experiments. D–F show a representative experiment of 3. Data are presented as mean ± SEM. Student’s t test; *P < 0.05, **P < 0.01, ***P < 0.001.

