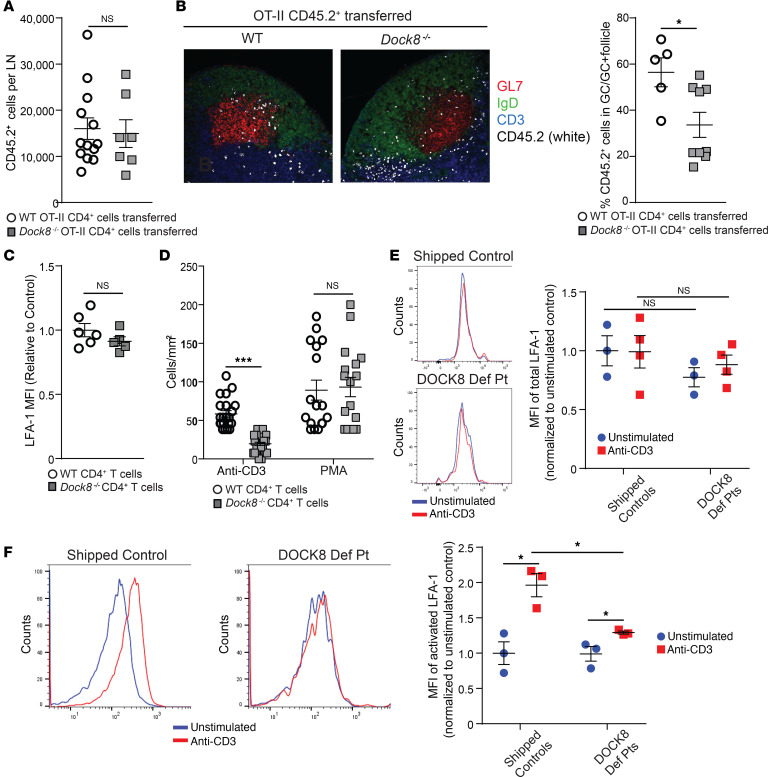
Figure 4. DOCK8-deficient CD4+ T cells have decreased migration into GCs and impaired activation of LFA-1.
(A and B) CD4+CD45.2+ OT II WT or DOCK8-deficient T cells were adoptively transferred into CD45.1+ WT mice. Recipients were immunized with NP-OVA in the hock, and popliteal LNs were analyzed on day 9 after immunization. (A) The number of OT II CD45.2+ T cells found in the draining LNs of recipient mice was analyzed by flow cytometry. (B) Localization within the draining LNs of transferred CD4+CD45.2+ OT II WT or DOCK8-deficient T cells was examined by immunofluorescence microscopy. Representative photomicrographs at ×20 magnification: B cell follicles (IgD+) are in green, GCs (GL7+) in red, CD45.2+ T cells in white, and T cell zones (CD3+) in blue. Percentage of CD45.2+ in GCs relative to total CD45.2+ cells in GC plus the surrounding follicle normalized to the GC and follicle area. n = 5 mice/group. (C) MFI of total surface LFA-1 expression on CD4+ T cells from Dock8–/– mice and WT controls. (D) Number of adherent CD4+ T cells, stimulated with anti-CD3 or PMA from Dock8–/– mice and controls, to ICAM-1 10 minutes after application to a flow chamber with a flow rate of 0.75 dynes/cm2. Five fields were examined per slide. (E) Representative histograms and MFI of LFA-1 surface expression by unstimulated and anti-CD3–stimulated CD4+ T cells from DOCK8-deficient patients (DEF Pt) and healthy shipped controls (n = 3/group). MFI values were normalized to the mean value of shipped controls. (F) Representative histograms and MFI of activated LFA-1 expression by unstimulated and anti-CD3–stimulated CD4+ T cells from DOCK8-deficient patients and healthy shipped controls (n = 3/group). MFI values were normalized to the mean value of unstimulated shipped controls. Results in C and D are from 3 independent experiments, each with 3 mice/group. Data in A–F are presented as mean ± SEM. In A–C, Student’s t test; *P < 0.05. In D–F, 1-way ANOVA with Tukey’s multiple comparisons; *P < 0.05, **P < 0.01, ***P < 0.001.

