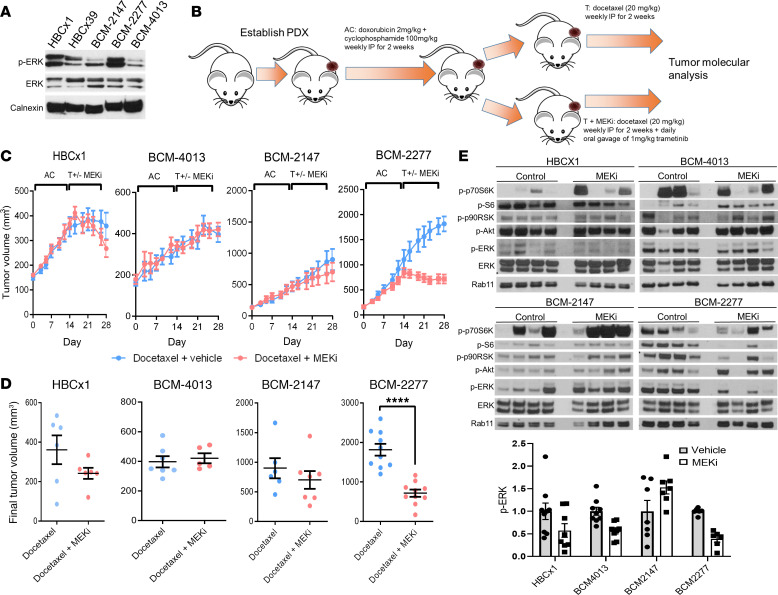
Figure 1. Therapeutic and transcriptional response of TNBC PDX models to standard chemotherapy or standard chemotherapy with MEK inhibition.
(A) Representative Western blot of untreated tumors from PDX models. (B) Schematic for treatment of PDX models. (C) Tumor growth curves for PDX models. (n = 5–10 per condition.) AC, adriamycin (doxorubicin) and cyclophosphamide; T, taxane (docetaxel). (D) Final tumor volumes at 28 days. (n = 5–10 per condition.) P value represents 2-sample 2-tailed t test. (E) Western blot of representative treated tumors from C and D. ****P < 0.0001.

