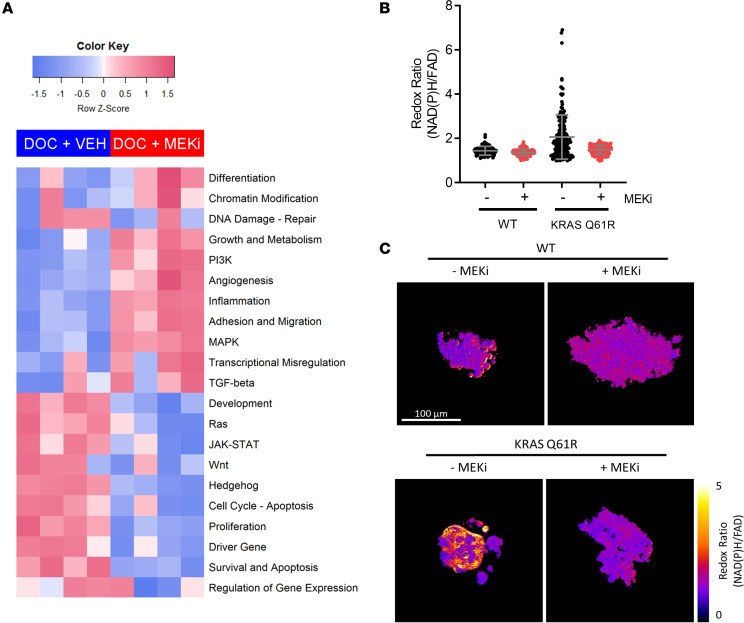
Figure 2. Metabolic and inflammatory phenotypes result from KRAS activation and are abrogated by MEK inhibition.
(A) Gene set analysis of BCM-2277 tumors treated with AC→docetaxel + vehicle or AC→docetaxel + trametinib. Signature scores were calculated and visualized using the nSolver package (NanoString). (n = 4.) (B) Single-cell–level optical metabolic imaging of tumor organoids derived from BCM-2147 (KRASWT) and BCM-2277 (KRASQ61R) tumors, treated for 72 hours in the presence of 50 nM trametinib or DMSO control. (n > 75.) (C) Representative metabolic imaging of organoids from B.

