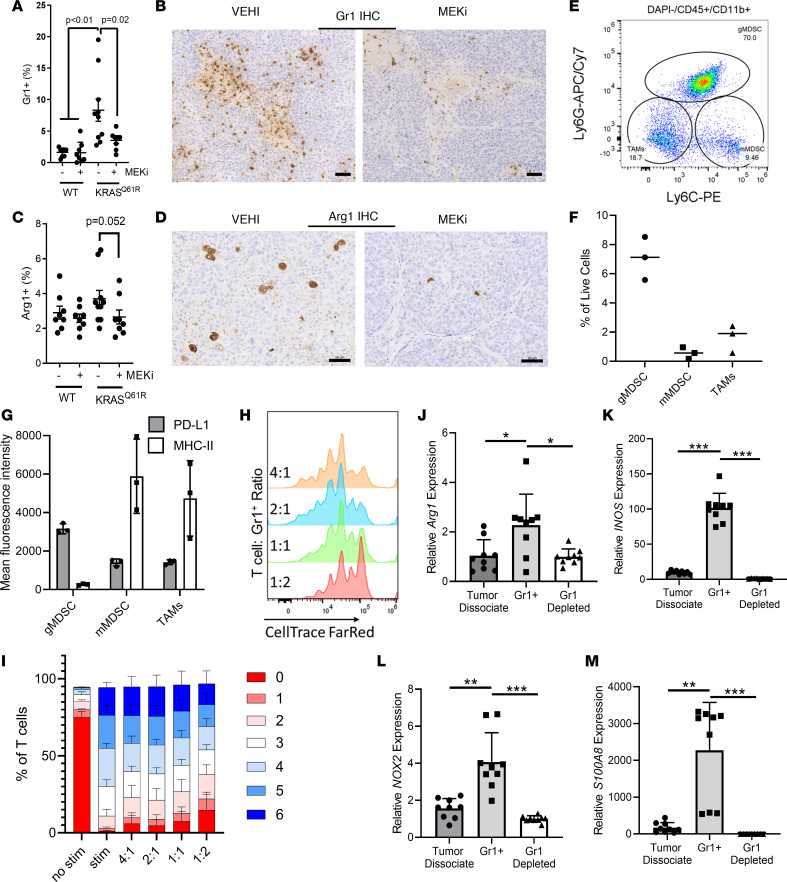
Figure 4. Myeloid recruitment to TNBC is mediated by Ras/MEK-dependent CXCL1/2 expression.
(A) Quantification of Gr1+ myeloid cells in the tumor microenvironment in BCM-2147 (KRASWT) and BCM-2277 (KRASQ61R) tumors after treatment with AC/docetaxel + vehicle (VEHI) or AC/docetaxel + trametinib (MEKi). (n = 8–10.) Identified P values represent Tukey’s post hoc comparisons following 1-way ANOVA (P < 0.0001). (B) Representative images of Gr1+ cells from BCM-2277 VEHI- and MEKi-treated tumors (Scale bar: 50 μm). (C) Quantification of Arg1+ myeloid cells in the tumor microenvironment in BCM-2147 (KRASWT) and BCM-2277 (KRASQ61R) tumors after treatment with AC/docetaxel + vehicle (VEHI) or AC/docetaxel + trametinib (MEKi). (n = 8–10.) One-way ANOVA was nonsignificant. P value represents a 2-sample, 1-tailed t test between the MEKi and control arms of the KRASQ61R model. (D) Representative images of Arg1+ cells from BCM-2277 VEHI- and MEKi-treated tumors. (Scale bar: 50 μm.) (E) Flow cytometry analysis of Ly6C/Ly6G expression in untreated BCM-2277 (KRASQ61R) tumors, gated on DAPI–CD45+CD11b+. mMDSC, monocytic MDSC. (F) Relative percentages of 3 populations of myeloid cells as defined in E among 3 tumors. (G) Mean fluorescence intensity of PD-L1 and MHC-II (IA-IE) in the 3 myeloid populations in E. (H) T cell proliferation after 72 hours of coculture with Gr1+ cells and CD3/CD28 bead stimulation measured by CellTrace Far Red fluorescence. (I) Distribution of T cell proliferation in 72-hour cocultures with Gr1+ cells across 3 independent experiments. (J–M) RNA isolated from tumor dissociates, Gr1+ cells, and Gr1-depleted dissociates was probed for Arg1, INOS, NOX2, and S100A8 by qRTPCR (n = 3).

