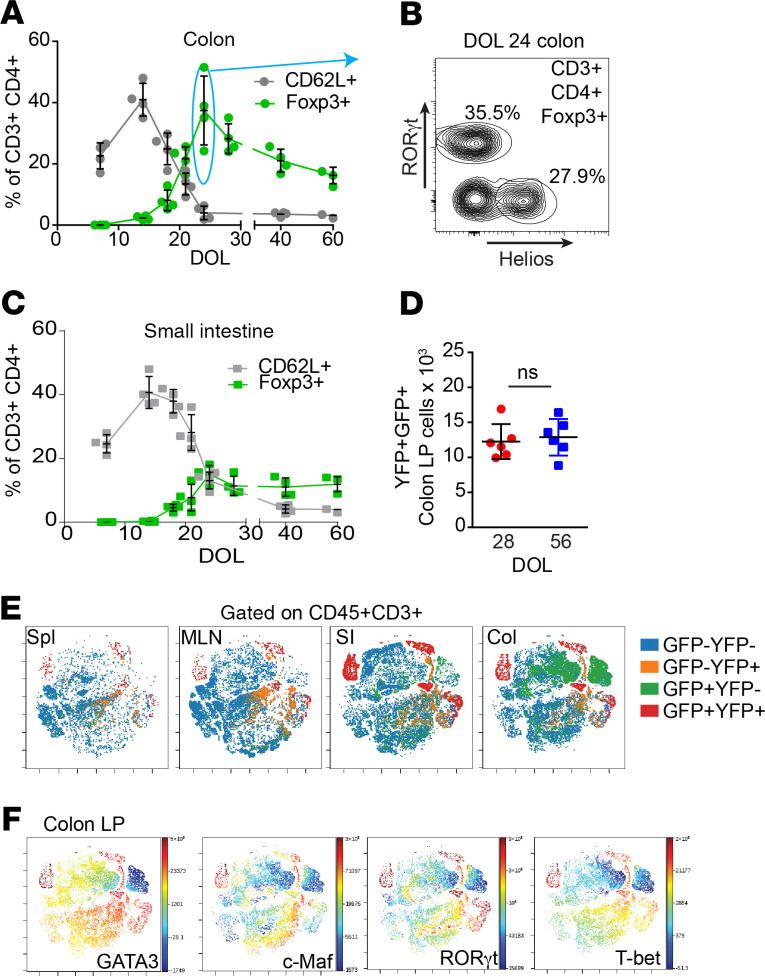
Figure 2. A Long-lived diverse Treg population develops in the colon during a pre- and periweaning period.
(A) Naive (CD62L+) T cell and Treg (Foxp3+) populations in the colon LP in early life assessed by flow cytometry. (B) Helios and RORγt+ expression by DOL24 Foxp3+CD4+CD3+ colonic LP cells. (C) Naive (CD62L+) T cell and Treg (Foxp3+) populations in the SI LP in early life assessed by flow cytometry. (D) Absolute number of colonic Foxp3+ (GFP+) cells that express YFP on DOL28 or DOL56 following inducible expression of YFP on DOL24 in Foxp3GFPERT2CreROSAlslYFP mice. (E) viSNE plots of T cells from spleen (spl), mesenteric lymph node (MLN), SI, or Colon LP of DOL56 Foxp3GFPERT2CreROSAlslYFP mice following inducible expression in DOL24 analyzed by GFP and YFP. (F) viSNE plots demonstrating transcription factor expression by colon LP T cells isolated and clustered as in E. Data are presented as the mean ± SEM. *P < 0.05; each dot represents 1 mouse analyzed. B is representative of 1 of 4 mice analyzed; n = 4 or more mice in panels E and F; and offspring from 3 litters were used in A–F. Significance calculated using a 2-tailed Student’s t test in D.

