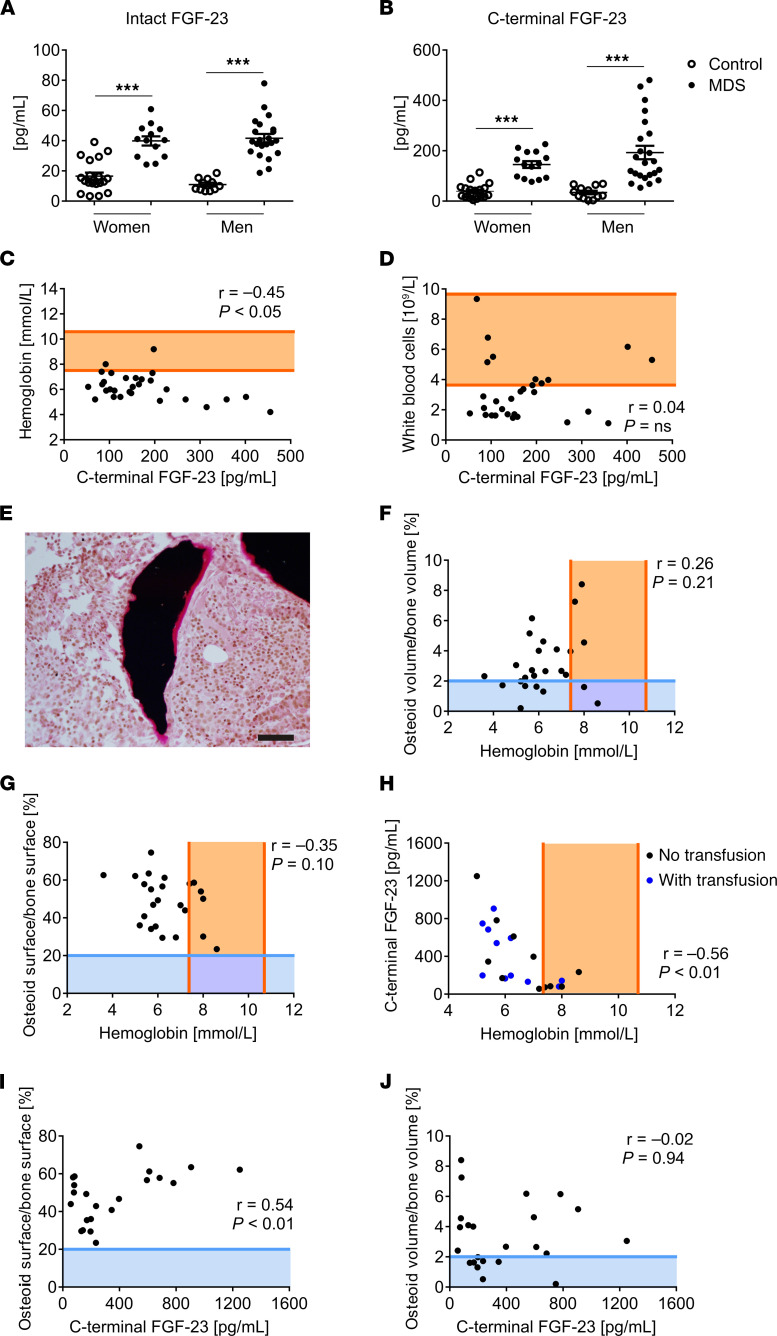
Figure 5. Patients with MDS display high levels of FGF23 and impaired bone mineralization.
(A and B) Intact (A) and C-terminal (B) FGF‑23 serum levels of treatment-naive MDS patients (women, n = 15; men, n = 23) compared with controls (women, n = 20; men, n = 13) were measured by ELISA. Data are shown as mean ± SD and were analyzed by the Student′s t test. ***P < 0.001 vs. control. (C and D) Scatter plots and Pearson correlation coefficient (r) of the C-terminal FGF‑23 and hemoglobin levels (n = 29) (C) or WBC (n = 29) (D). To determine the amount of nonmineralized bone matrix in MDS patients, iliac crest bone biopsies were collected. (E) Representative image of von Kossa/van Gieson–stained biopsy is depicted using CellSens program and Microscope Axio Imager M1 (Carl Zeiss). Osteoid is stained in pink. Magnification, 40× (scale bars: 20 μm). (F–J) Scatter plots and Pearson correlation coefficient (r) were applied to determine the dependence of hemoglobin levels and osteoid volume per bone volume (n = 26) (F), osteoid surface per bone surface (n = 24) (G), or C-terminal FGF‑23 (n = 22) (H), as well as the correlation between C-terminal FGF‑23 and osteoid surface per bone surface (n = 22) (I) or osteoid volume per bone volume (n = 23) (J). In all scatter plots, each dot represents an MDS patient. The reference range of healthy individuals for hemoglobin levels or WBC is shown in orange and, for osteoid volume per bone volume or osteoid surface per bone surface, in blue.

