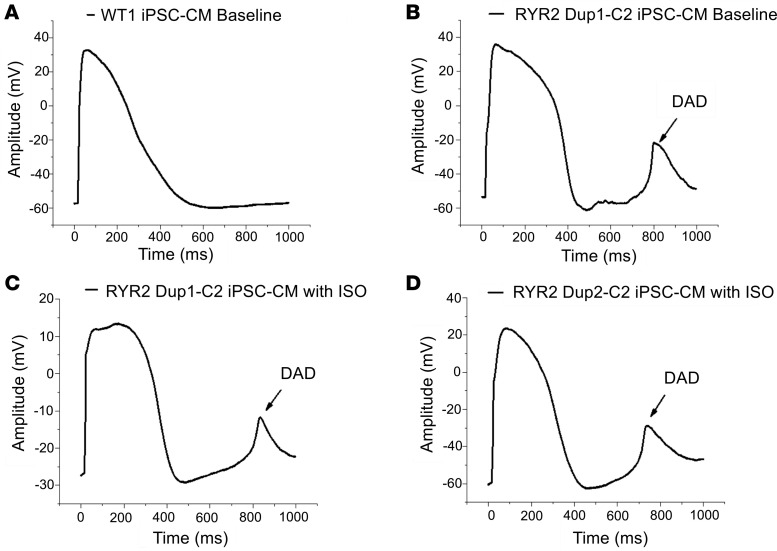
Figure 5. Action potential recordings by patch-clamp showing DAD events in RYR2 duplication iPSC-CMs.
Representative action potential traces from (A) WT (WT1) control iPSC-CMs (n = 10) and (B) RYR2 Dup 1-c2 mutant iPSC-CMs under baseline conditions (n = 10) and (C) RYR2 Dup 1-c2 mutant (n = 8) and (D) RYR2 Dup 2-c2 mutant (n = 5) iPSC-CMs following ISO (100 nM) treatment. DAD events are indicated by the arrow.

