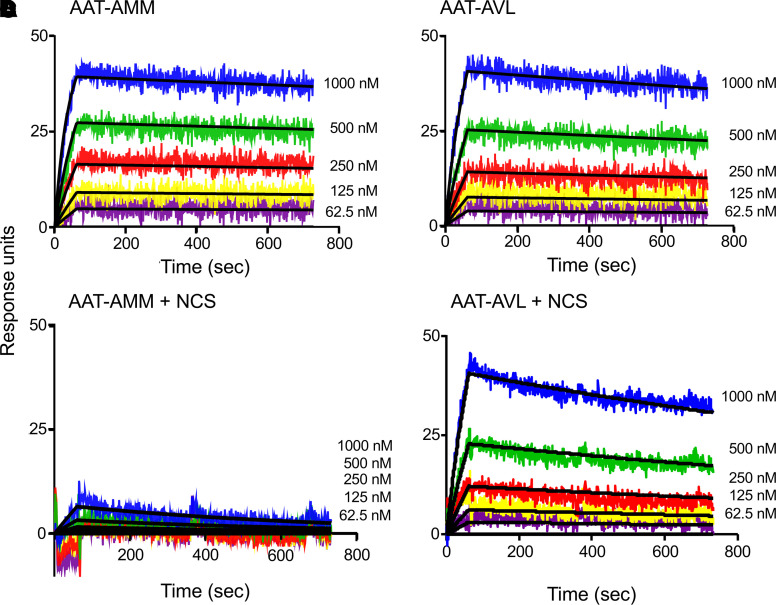
Figure 4. Association rates between human AAT and NE measured by surface plasmon resonance under normal and oxidizing conditions.
NE was coupled to the sensor chip, and serial 2-fold dilutions of AAT were flowed across and allowed to bind (AAT: 1000 nM shown in blue, 500 nM shown in green, 250 nM shown in red, 125 nM shown in yellow, 62.5 nM shown in purple). Curve fit to the Langmuir binding model (black line) (98). Binding curves are shown from 1 representative experiment of 3 independent experiments. (A) AAT-AMM binding to NE under normal conditions. (B) AAT-AVL binding to NE under normal conditions. (C) AAT-AMM binding to NE after exposure to 1 mM NCS for 20 minutes. (D) AAT-AVL binding to NE after exposure to 1 mM NCS for 20 minutes. See Table 1 for association rates and statistical comparisons.

