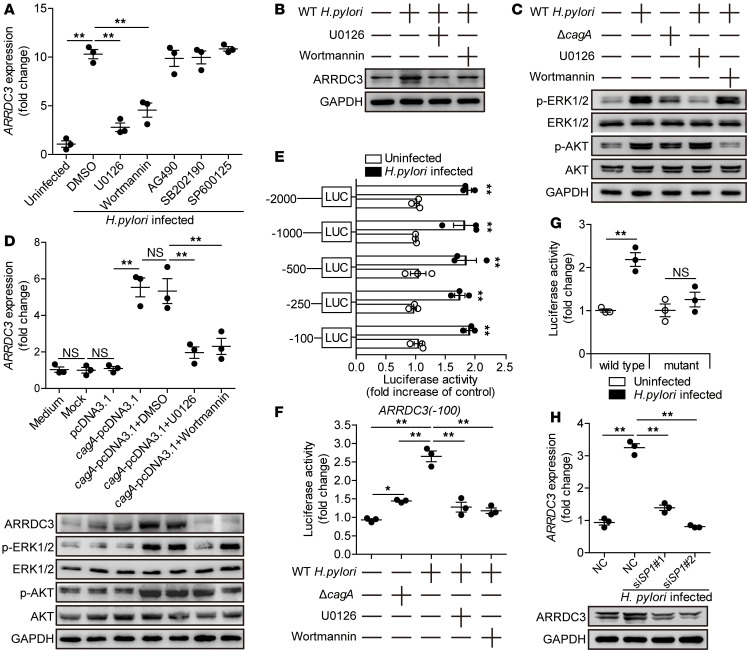
Figure 3. H. pylori induces gastric epithelial cells to express ARRDC3 via ERK and PI3K-AKT pathways.
(A) AGS cells were pretreated with signal pathway inhibitors and then infected with WT H. pylori (MOI = 100) for 24 hours. ARRDC3 expression in AGS cells was compared (n = 3). (B) AGS cells were pretreated with U0126 (an ERK inhibitor) or Wortmannin (a PI3K-AKT inhibitor) and then infected with WT H. pylori (MOI = 100) for 24 hours. ARRDC3 protein was analyzed by Western blot. (C) AGS cells were pretreated with U0126 (an ERK inhibitor) or Wortmannin (a PI3K-AKT inhibitor) and then infected with WT H. pylori or ΔcagA (MOI = 100) for 24 hours. ERK1/2, p-ERK1/2, AKT, and p-AKT proteins were analyzed by Western blot. (D) AGS cells were transfected with plasmids pcDNA3.1 or cagA-pcDNA3.1 for 24 hours and then treated with or without U0126 or Wortmannin for 2 hours before being cultured for an additional 24 hours. ARRDC3 expression and ARRDC3 protein were analyzed by real-time PCR and Western blot (n = 3). (E) AGS were transfected with luciferase reporter constructs containing the ARRDC3-luc promoter for 4 hours. Luciferase activity was measured to assess promoter activity after WT H. pylori infection (MOI = 100) for 24 hours. (F) AGS were transfected with luciferase reporter constructs containing the ARRDC3-luc promoter for 4 hours. Luciferase activity was measured to assess promoter activity after WT H. pylori (pretreated with or without U0126 or Wortmannin) or ΔcagA infection (MOI = 100) for 24 hours. (G) AGS cells were transfected with the ARRDC3-luc (–100/0) construct (WT) or a mutant construct (mutant). Luciferase activity was measured to assess promoter activity after WT H. pylori infection (MOI = 100) for 24 hours. (H) SP1 siRNA (siSP1 1 and siSP1 2) or nonspecific control siRNA (NC) pretreated AGS cells were infected with WT H. pylori (MOI = 100) for 24 hours. ARRDC3 expression were analyzed by real-time PCR and Western blot (n = 3). Data are representative of 2 independent experiments. Data are mean ± SEM and analyzed by Student t test, Mann-Whitney U test, and 1-way ANOVA. Western blot results are run in parallel and contemporaneously. *P < 0.05, **P < 0.01 for groups connected by horizontal lines or compared with uninfected cells.

