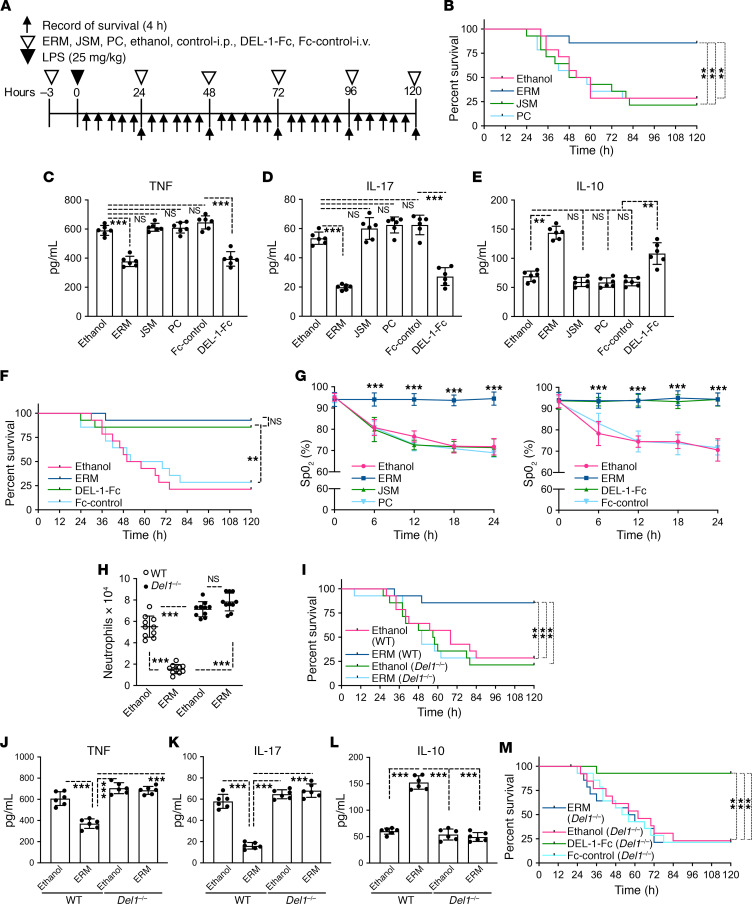
Figure 3. ERM improves mouse survival after LPS-induced acute lung injury in a manner comparable to that of DEL-1–Fc.
(A) Experimental design. E. coli LPS (25 mg/kg; lethal dose) was administrated intratracheally. ERM, JSM, PC (all 3 antibiotics at 20 mg/kg), or ethanol control was administrated i.p., while DEL-1–Fc (10 μg) or Fc control (3.3 μg; equal molar amount with 10 μg DEL-1–Fc) was administered intravenously, at the indicated time points. (B) Survival rates for mice treated with ethanol control, ERM, JSM, or PC and subjected to acute lung injury by LPS (n = 14 mice/group). (C–E) Determination of TNF (C), IL-17 (D), and IL-10 (E) serum levels in LPS-challenged mice treated with ERM (or controls) or DEL-1–Fc (or Fc control); serum was collected 24 hours after LPS administration (n = 6 mice/group). (F) Survival rates of mice treated with DEL-1–Fc or Fc-control and subjected to acute lung injury by LPS (n = 14 mice/group). (G) Dynamics of oxygen saturation (SpO2) levels in mice subjected to LPS-induced acute lung injury over the course of 24 hours following LPS administration and treatment with the indicated antibiotics (left panel), DEL-1–Fc (right panel), or controls (ethanol or Fc) (n = 10 mice/group). (H and I) WT and Del1–/– mice were challenged with LPS and treated with ERM (or ethanol control) or DEL-1–Fc (or Fc control) as outlined in panel A. Neutrophil numbers were calculated in the BALF of WT and Del1–/– mice 24 hours after LPS administration (n = 10 mice/group) (H). Survival rate of WT and Del1–/– mice subjected to LPS-induced acute lung injury (n = 14 mice/group) (I). (J–L) Serum levels of TNF (J), IL-17 (K), and IL-10 (L) in LPS-challenged WT and Del1–/– mice treated with ERM (or ethanol control) or DEL-1–Fc (or Fc control); serum was collected 24 hours after LPS administration (n = 6 mice/group). (M) Survival rate of LPS-challenged Del1–/– mice treated with ERM (or ethanol control) or DEL-1–Fc (or Fc control) (n = 14 mice/group). Data are presented as the mean ± SD. **P < 0.01 by the log-rank test (B, F, I, and M). **P < 0.01, ***P < 0.001 by 1-way ANOVA followed by Tukey’s multiple comparisons test (C, D, E, H, J, K, and L). ***P < 0.001 by 2-way ANOVA followed by Holm-Šidák multiple comparisons test (G).

