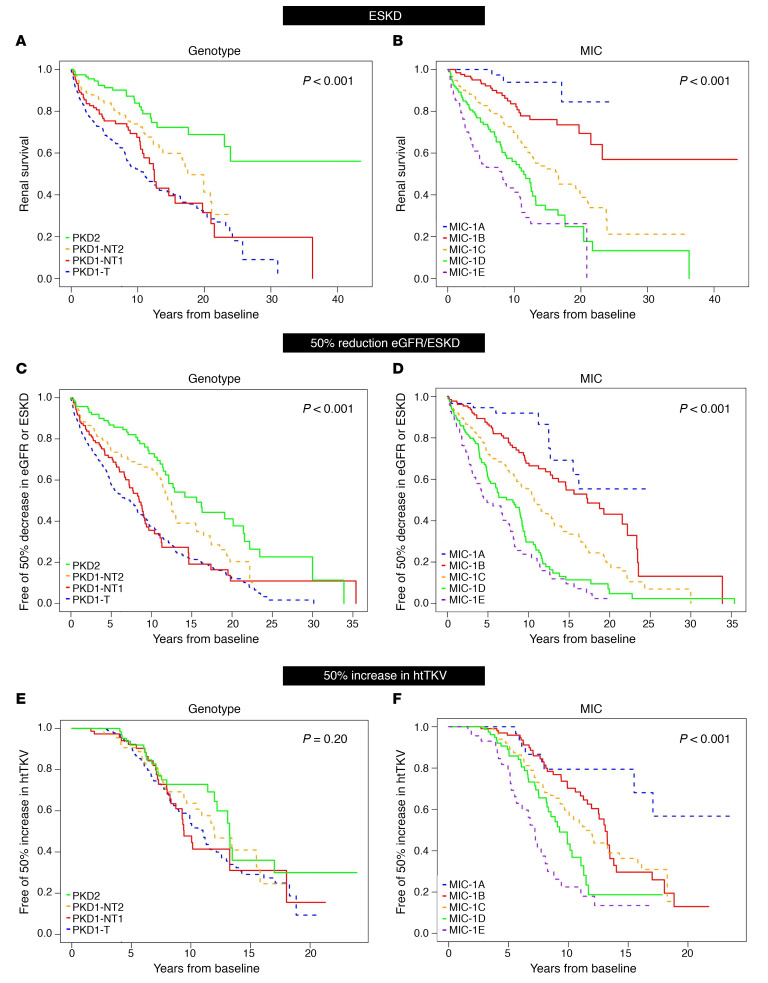
Figure 3. Unadjusted Kaplan-Meier analysis from baseline of functional and structural kidney disease endpoints.
(A–F) Unadjusted Kaplan-Meier renal survival analysis (A and B), eGFR < 50%/ESKD (C and D), or 50% increase in htTKV (E and F) from baseline analyzing genotype (A, C, and E) and MIC (B, D, and F), with P values shown. Median years to ESKD from baseline are: 11.0y, 12.5y, and 17.5y for PKD1T, PKD1NT1, and PKD1NT2, respectively, with less than 50% of PKD2 patients reaching ESKD throughout follow-up (A, n = 796, P < 0.001) and 8.1y, 11.4y, and 16.4y for MIC-1E, -1D, and -1C, respectively, with less than 50% of -1B and -1A patients reaching ESKD throughout follow-up (B, n = 577, P < 0.001). Median years to a eGFR < 50%/ESKD from baseline are: 7.3y, 8.5y, 12.5y, and 15.6y for PKD1T, PKD1NT1, PKD1NT2, and PKD2, respectively (C, n = 796, P < 0.001) and 4.9y, 8.1y, 10.7y, and 17.3y for MIC-1E, -1D, -1C, and -1B, respectively, with less than 50% of -1A patients reaching the endpoint (D, n = 577, P < 0.001). Median years to htTKV > 50% from baseline was not significantly different between genotypic groups: 11.0y, 9.4y, 12.0y, and 13.3y for PKD1T, PKD1NT1, PKD1NT2, and PKD2, respectively (E, n = 468, P = 0.20). However, MIC was significant different for the htTKV > 50% endpoint: 7.2y, 9.3y, 11.4y, and 13.1y for MIC-1E, -1D, -1C, and -1B, respectively, with less than 50% of -1A cases reaching the endpoint (F, n = 468, P < 0.001).

