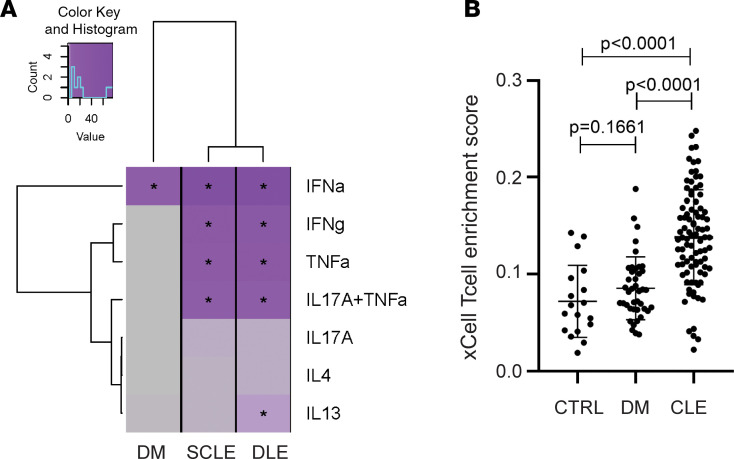
Figure 4. DM exhibits fewer T cell–related genes compared with CLE.
(A) Heatmap of overlap of DM, SCLE, and DLE lesional DEGs with cytokine signatures generated via stimulation of keratinocytes with indicated cytokines followed by RNA-Seq. (B) xCell analysis shows no increase in total T cell score (driven by CD4+ central memory, effector memory, memory, and naive cells and CD8+ central memory, effector memory, and naive cells) in DM lesions versus healthy control (HC) whereas CLE has a high T cell score. Bars depict SD.

