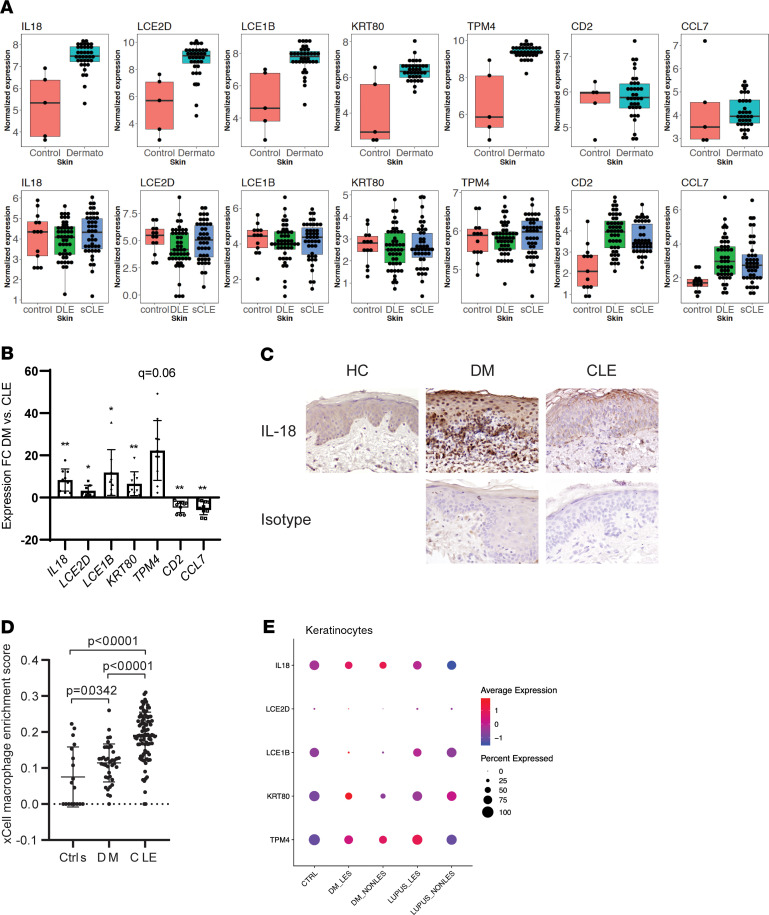
Figure 5. DM lesions can be distinguished by a 5-gene score and exhibit increased IL-18 in dermal inflammation.
(A) Box plots of DEGs in DM but not CLE (IL18 and LCE2D) or DEGs in CLE but not DM (CCL7 and CD2). (B) RNA was isolated from 9 DM and 9 CLE lesional samples from the independent validation cohort and subjected to real-time PCR with the indicated primers. Data are presented as the fold change calculated as 2-ΔΔCT of DM versus CLE. Statistical significance was calculated via multiple 2-tailed t tests using false discovery rate to account for multiple comparisons of delta CT values normalized to GAPDH expression. The q values are denoted on the graph as follows: *q < 0.05; **q < 0.01. (C) IHC for IL-18 or isotype control in healthy control (representative of 3 controls), DM (representative of 3 patients), and CLE skin (representative of 4 patients). (D) xCell enrichment score for macrophage-derived transcripts in HC, DM, and CLE lesions. (E) scRNA-Seq analysis of DM lesional and nonlesional skin compared with healthy control and lupus skin. Graph represents gene expression in keratinocytes for percentage of cells expressing the indicated gene (by circle size) and degree of expression (by color).

