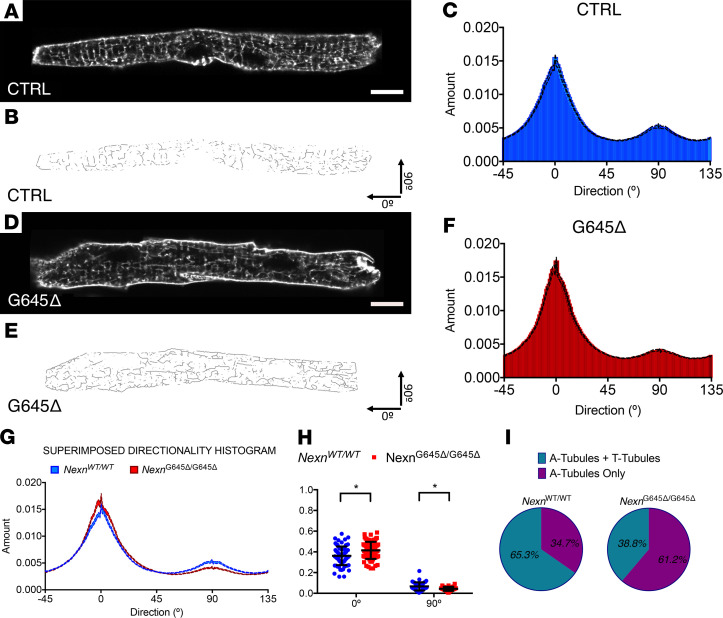
Figure 4. NexnG645Δ/G645Δ mice have a disorganized transverse-axial tubule system.
(A and D) Representative live confocal images of cardiomyocytes stained with Di-8 Anepps isolated from NexnWT/WT and NexnG645Δ/G645Δ mice at P10 (n = 3). Scale bar: 10 μm. (B and E) Relative skeletonized images, oriented in a x-y fashion: T-tubules represent the 90° component and axial tubules the 0° component. (C and F) Directionality histograms derived from Fourier transforms of all the analyzed cardiomyocytes images. (G) Comparison between directionality histograms from C and F. (H) NexnWT/WT and NexnG645Δ/G645Δ comparison of area under curve from 90° and 0° tubular Fourier components Gaussian distribution. (I) Distribution of cardiomyocytes with a formed transverse-axial tubule system (A-tubules + T-tubules) and immature cardiomyocytes presenting only with a longitudinal tubular component (A-tubules only) in NexnWT/WT and NexnG645Δ/G645Δ mice at P10. *P < 0.05. Data represent mean ± SEM; differences between groups were analyzed by 2-tailed Student’s t test.

