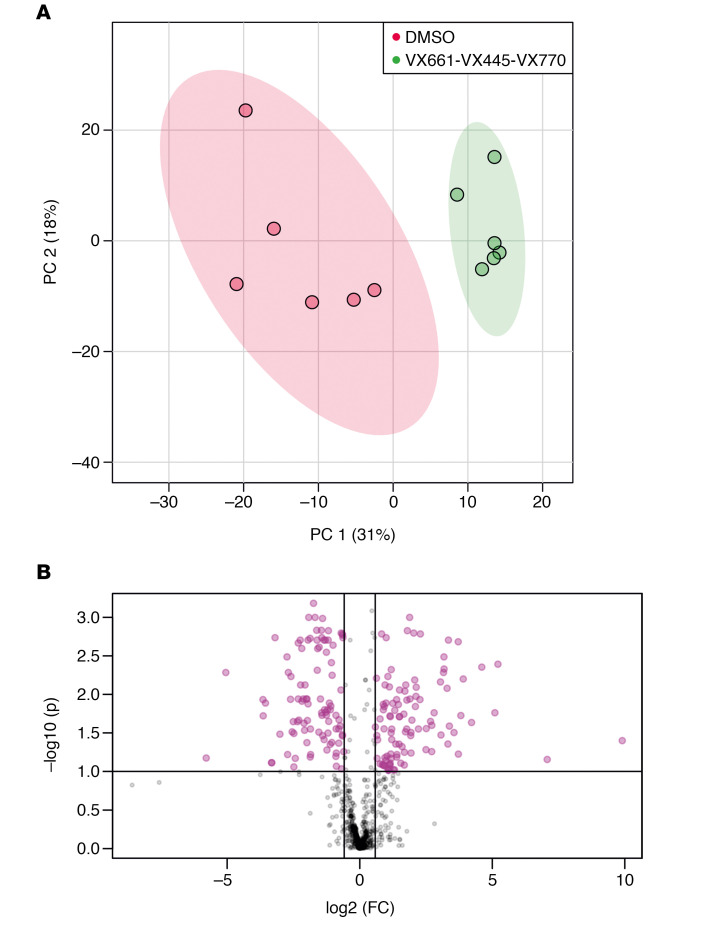
Figure 5. Effect of triple combination on the CFBE41o- lipidome.
(A) PCA score plot for the control and triple combination (VX-661/VX-445/VX-770) comparison. The 2 groups are separated in unsupervised data analysis. (B) Volcano plot for the same comparison. The features with a fold change greater than 1.5 (FDR-adjusted P = 0.1) are indicated in purple along with the regulation status following treatment with Trikafta.

