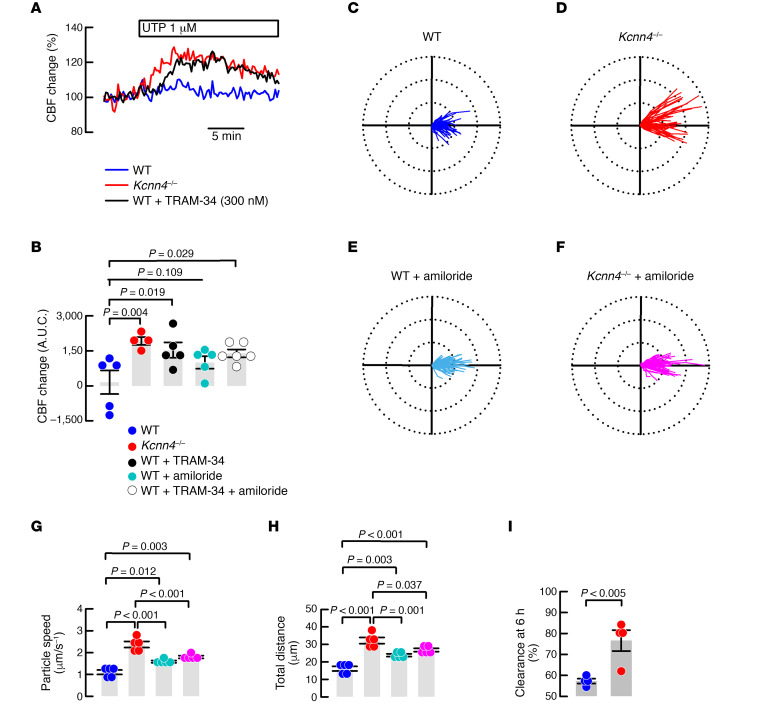
Figure 2. Mucociliary clearance is enhanced after KCa3.1 inhibition in the mouse.
(A) CBF changes in Kcnn4–/– or WT cells treated with TRAM-34 (100 nM) after UTP stimulation of tracheal epithelial cell explants. (B) Quantification of the area under the curve of CBF recordings including WT explants treated with amiloride (10 μM) and/or TRAM-34. Differences were calculated using ANOVA on ranks; n = 5, 4, 5, 5 and 6, respectively. Polar plots (75 μm radius) of the trajectory of beads placed in (C) WT (80 beads), (D) Kcnn4–/– (68 beads), (E) WT plus 10 μM amiloride (84 beads), and (F) Kcnn4–/– plus 10 μM amiloride (81 beads) tracheae, corresponding to 5 different experiments for each group. Calculated speed of particles (G) and total distance (H) from the experiments shown in C–F. Differences were calculated using ANOVA on ranks. (I) In vivo lung clearance of fluorescently labeled OVA in WT (n = 4) and Kcnn4–/– (n = 4) mice. Difference was calculated using rank-sum test. CBF, ciliary beating frequency; UTP, uridine-5′-triphosphate.

