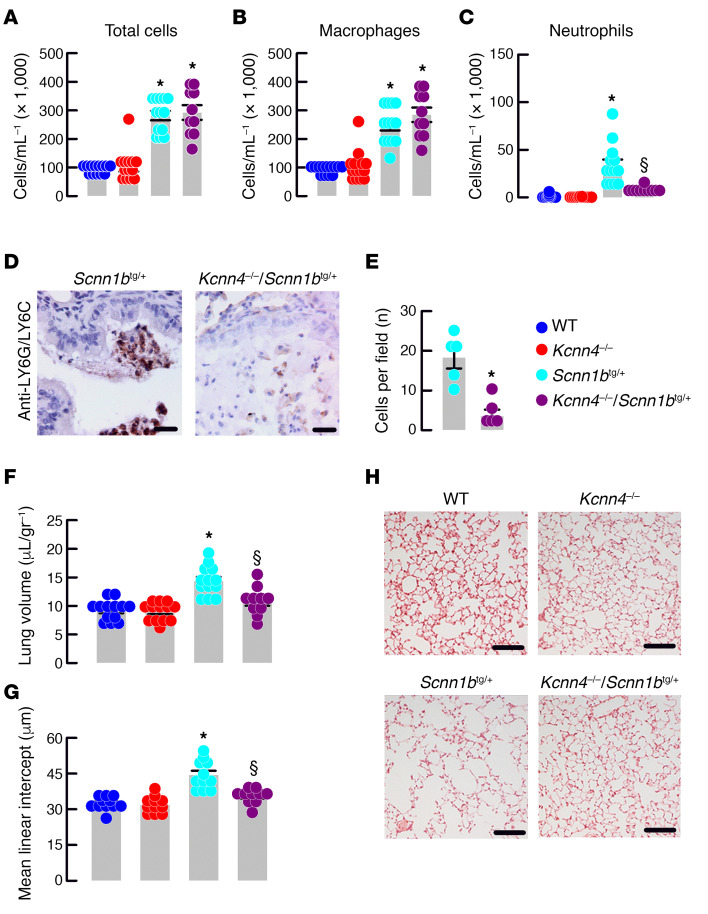
Figure 4. Genetic silencing of Kcnn4 reduces lung inflammatory disease in mice with muco-obstructive lung disease.
Total cells (A) and macrophages (B) quantification in BALF. *P < 0.05 vs. WT and Kcnn4–/–. Neutrophils (C) quantification in BALF. *P < 0.05 vs. all other groups and § indicates the difference vs. Scnn1btg/+. ANOVA on ranks; n = 13, 13, 13, and 10 for WT, Kcnn4+/+, Scnn1btg/+, and double mutants, respectively. Representative images (n = 5 each group; scale bar: 20 μm) of LY6G/LY6C immunostaining in mucus plugs (D). Quantification of LY6G/LY6C-positive cells (E) in the Scnn1btg/+ (n = 5) and double mutants (n = 5). *P < 0.05 calculated by rank-sum test. Mouse lung volume (F); *P < 0.05 vs. all other groups and § indicates the difference vs. Scnn1btg/+; ANOVA on ranks; n = 13, 13, 13, and 10 for WT, Kcnn4+/+, Scnn1btg/+, and double mutants, respectively. Mean linear intercept (G) calculated from images as shown in H (scale bar: 200 μm); *P < 0.05 vs. all other groups and § indicates the difference vs. Scnn1btg/+; ANOVA on ranks; n = 13, 13, 13, and 10 for WT, Kcnn4+/+, Scnn1btg/+, and double mutants, respectively.

