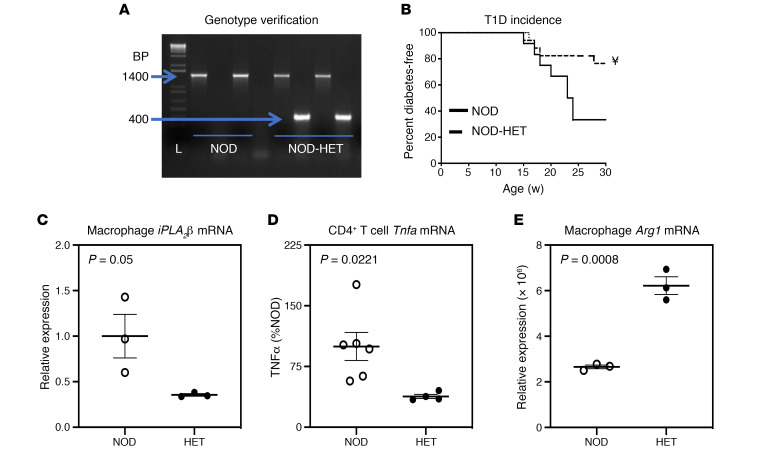
Figure 3. NOD.iPLA2β+/– genotype and diabetes phenotype.
(A) Genotype. DNA was generated from tail clips and progeny were genotyped by PCR analyses. Reactions were performed in the presence of primers for the WT sequence (NOD) or for the disrupted sequence (NOD-HET) for each mouse. The expected bands for the WT (1400 bp) and HET (1400 and 400 bp) in 2 mice each are presented. L, bp ladder. (B) T1D incidence. Blood glucose was monitored weekly for up to 30 weeks, and 2 consecutive readings of ≥ 275 mg/dL were recorded as onset of diabetes (n = 12 and 17 for NOD and NOD-HET groups, respectively). NOD-HET significantly different from NOD; ¥P < 0.001. (C) RNA was isolated from NOD (n = 3) and NOD-HET (n = 3) macrophages and cDNA prepared for iPLA2β mRNA analyses by qPCR. (D) Production of TNF-α by CD4+ T cells. Splenocytes were prepared from the NOD and NOD-HET, and CD4+ T cells were isolated and activated, as described in Methods. The media was collected at 72 hours, and TNF-α concentration was determined by ELISA (n = 3 per group). (E) RNA was isolated from NOD (n = 3) and NOD-HET (n = 3) macrophages and cDNA prepared for Arg1. Statistical analyses: (B) Mantel-Cox test; (C–E) Student’s t test.

