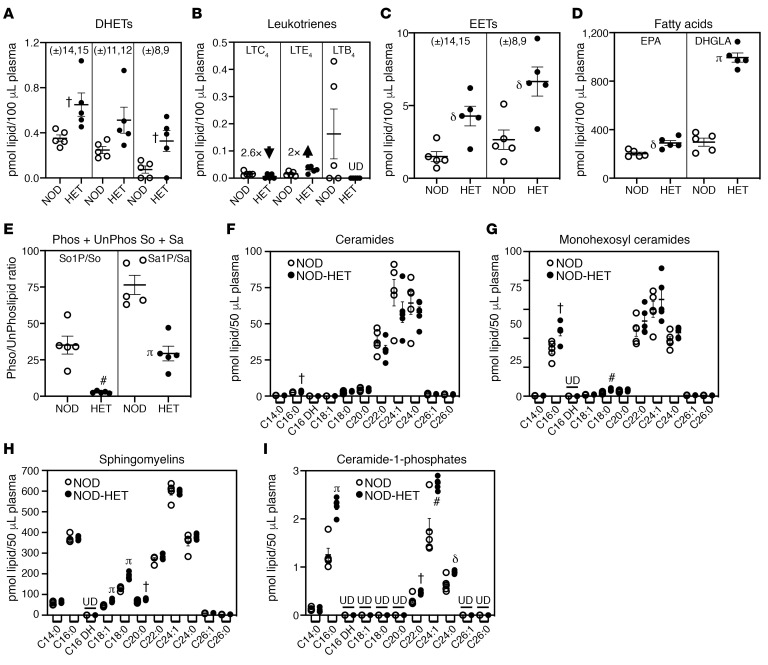
Figure 5. Comparison of select plasma lipids during the prediabetic phase.
(A–I) Plasma was prepared from NOD (n = 5) and NOD-HET (n = 5) and processed for lipidomics analyses of eicosanoids (A–C), fatty acids (D), and sphingolipids (E–I). The data (mean ± SEM) represent pmol of each lipid species in 100 μL (A–D) or 50 μL (E–I) plasma. (A) DHETs. (B) Leukotrienes. (C) EETs. (D) EPA and DHGLA. (E) Sphingosine and sphinganine (phosphorylated/nonphosphorylated). (F) Ceramides. (G) Monohexosyl Ceramides. (H) Sphingomyelins. (I) Ceramide-1-phosphates. NOD-HET significantly different from NOD, †P < 0.05; δP < 0.01; #P < 0.005; πP < 0.0005. Statistical analyses: Student’s t test. UD, undetected.

