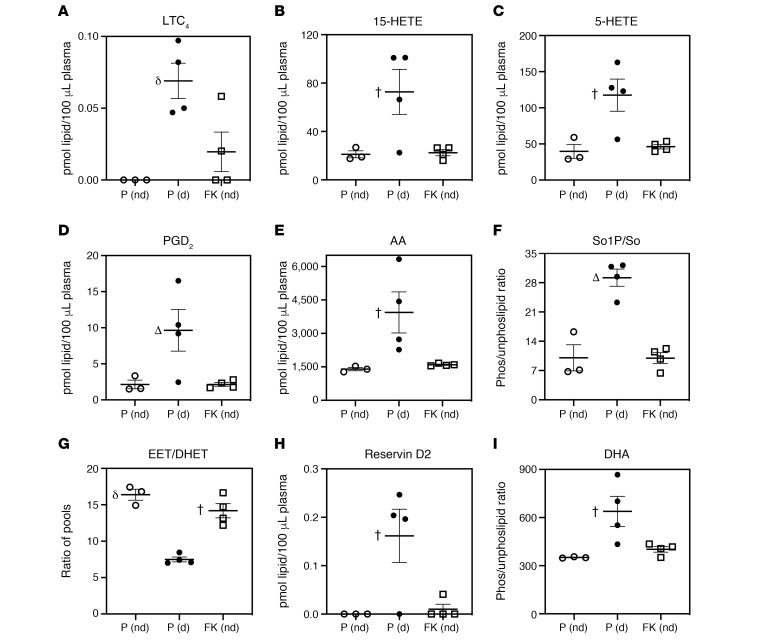
Figure 6. Comparison of select plasma lipids at T1D onset.
NOD mice were treated with PBS-T or with FKGK18, starting at 10 days of age, and sacrificed at the onset of T1D (d) or at 30 weeks if they remained nondiabetic (nd). Plasma was prepared from these mice and processed for lipidomics analyses. The data (mean ± SEM) represent pmol of each lipid species in 100 or 50 μL plasma. (A) LTC4. (B) 15-HETE. (C) 5-HETE. (D) PGD2. (E) AA. (F) So1P/So. (G) EET/DHET. (H) Resolvin D2. (I) DHA. n = 3, 4, and 4 for PBS-T (P [nd]), PBS-T (P [d]), and FKGK18 (FK [nd]), respectively. P (d) significantly different from the other groups, †P < 0.05; δP < 0.01; ΔP < 0.000001. One-way ANOVA.

