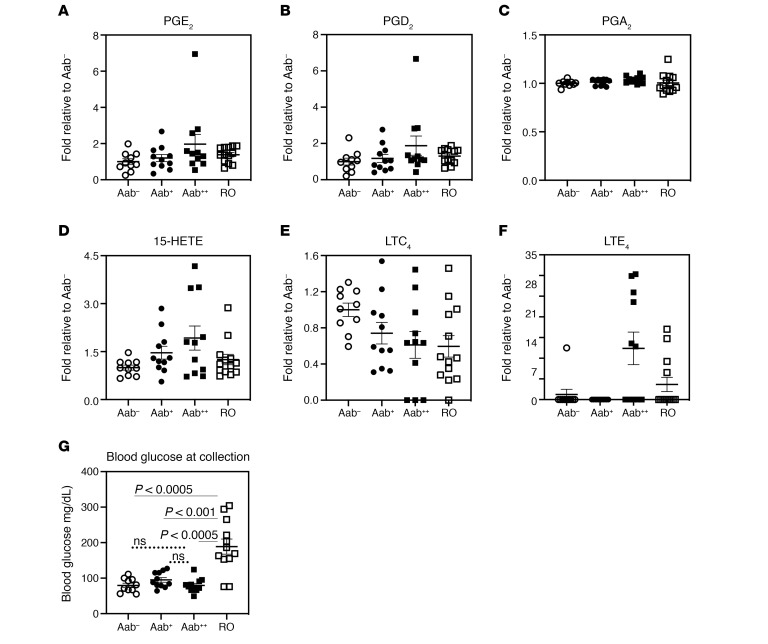
Figure 7. Diabetic and nondiabetic human plasma lipidome.
Lipidomics analyses were performed in plasma from euglycemic autoantibody negative (Aab–), 1 Aab-positive (Aab+), and 2 Aab-positive (Aab++), and recent T1D onset (3.34 ± 0.24 months T1D duration) (RO) subjects. The number of subjects, sex (female [F]/male [M]) distribution, and age (years) at visit are: Aab–, 10, 2F/8M, 9.26 ± 1.68; Aab+, 11, 6F/5M, 14.60 ± 1.38; Aab++, 11, 8F/3M, 12.43 ± 1.66; RO, 13, 9F/4M, 8.99 ± 1.33. (A–F) Fold-abundances in lipids, relative to Aab–, are presented with mean ± SEM. (G) Blood glucose at sample collection. Statistical analyses: (A–F) Pearson, Kendall, and Spearman’s rank order correlation; G, Student’s t test. All n is the same as previous panels, except RO = 12.

