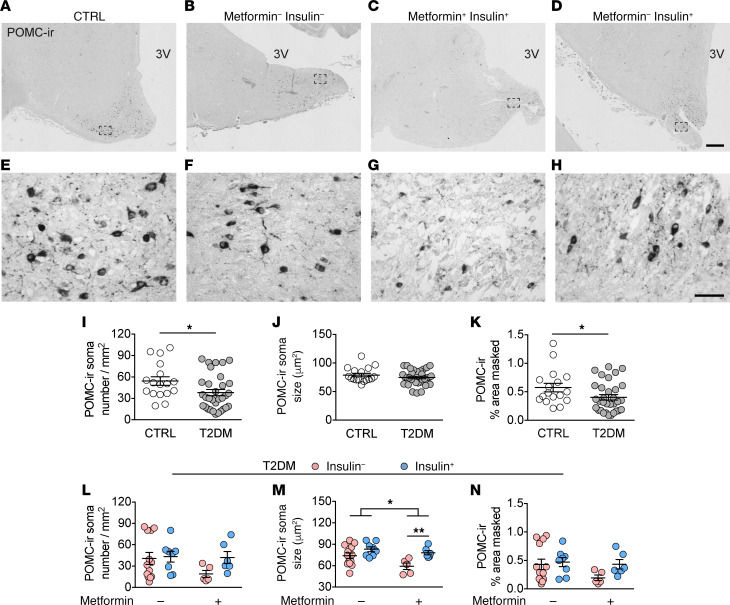
Figure 3. Decreased POMC-ir in the IFN of T2DM subjects can be prevented by insulin treatment.
(A–H) POMC-ir neurons in the IFN of a CTRL subject (A), T2DM subject with no insulin no metformin (B), with metformin (C), or with insulin (D) (higher magnification of the areas framed in A–D are shown in E–H, respectively). (I–K) Comparison between CTRL and T2DM of: POMC-ir neuronal number (I), POMC-ir soma size (J), and the relative area covered by POMC-ir (K). (L–N) The antidiabetic treatment-associated effect on POMC-ir neuronal number (L), POMC-ir soma size (M), and the relative area covered by POMC-ir (N). 3V, third ventricle. Scale bars: 500 μm (D), 50 μm (H). Data represent mean ± SEM. Significance is calculated using an ordinary Student’s t test in I, a Mann-Whitney test in K, and a 2-way ANOVA in M. All P values were corrected for multiple testing using the Benjamini-Hochberg criterion. *P < 0.05, **P < 0.01.

