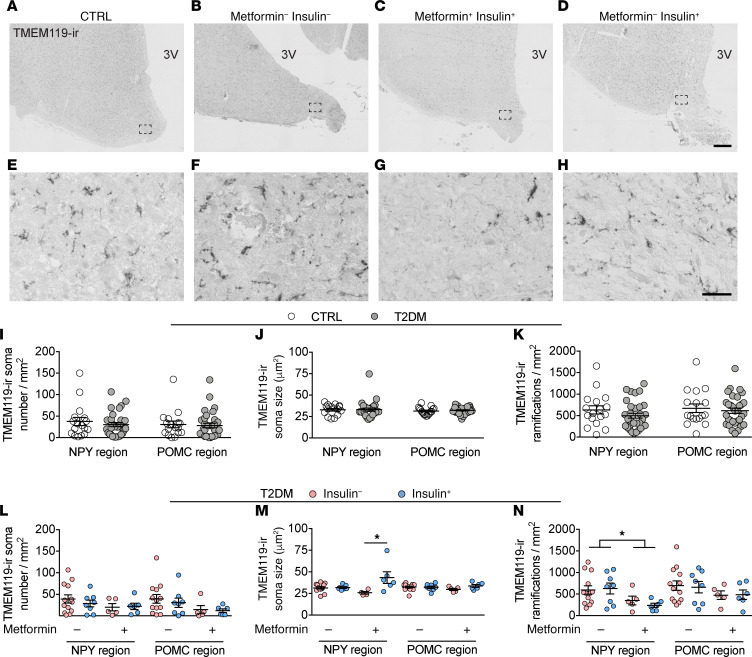
Figure 5. Locally changed TMEM119- ir in the NPY area in the IFN of the T2DM subjects treated with metformin.
(A–H) TMEM119-ir microglia in the IFN of a CTRL subject (A), T2DM subject with no insulin no metformin (B), with metformin and insulin (C), or with insulin (D) (higher magnification of the areas framed in A–D are shown in E–H, respectively). (I–K) Comparison in the NPY and POMC region between CTRL and T2DM of: TMEM119-ir soma number (I), TMEM119-ir soma size (J), and the number of TMEM119-ir ramifications (K). (L–N) The antidiabetic treatment-associated effects in the NPY and POMC region on TMEM119-ir soma number (L), TMEM119-ir soma size (M), and the number of TMEM119-ir ramifications (N). 3V, third ventricle. Scale bars: 500 μm (D), 50 μm (H). Data are represented as mean ± SEM. Significance is calculated using 2-way ANOVA in M and N. All P values were corrected for multiple testing using the Benjamini-Hochberg criterion. *P < 0.05.

