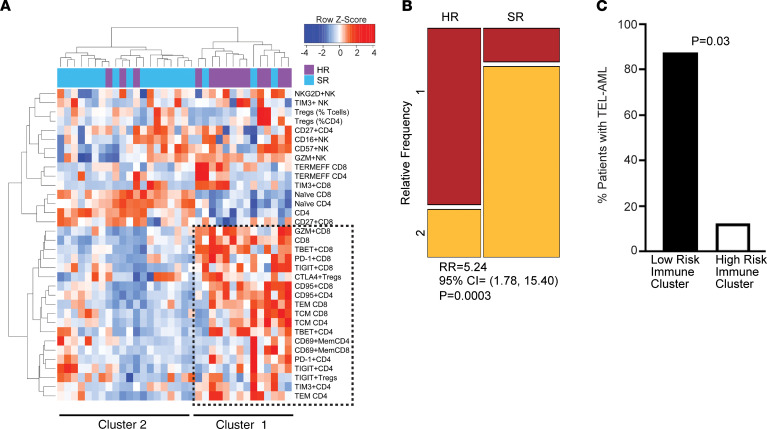
Figure 7. Distinct immune clusters associate with disease risk and outcome in childhood B-ALL.
BMMNCs from patients with standard-risk (SR, n = 22) and high-risk (HR, n = 16) B-ALL were characterized using single cell mass cytometry. (A) Hierarchical cluster analysis based on immune markers in B-ALL. (B) Mosaic plot showing distribution of HR and SR B-ALL patients in the 2 clusters (relative frequency in cluster 1 is in red and cluster 2 is in yellow). P value corresponds to Wald’s test. (C) Bar graph showing distribution of TEL-AML+ B-ALL patients in the immune clusters. P value corresponds to Wald’s test.

