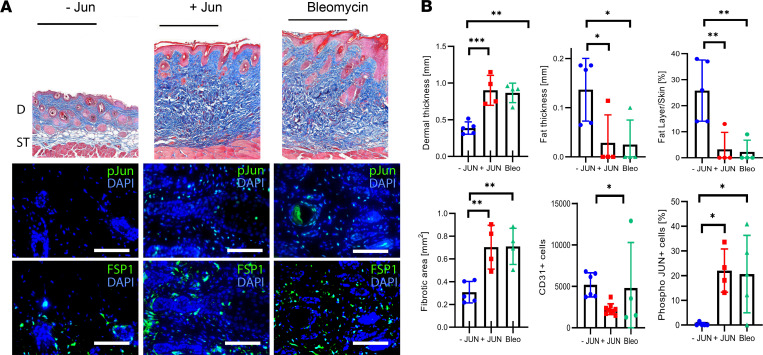
Figure 3. JUN induces skin fibrosis in mice.
(A) Representative trichrome stains and immunofluorescence stains against p-JUN and FSP1 without JUN induction (-JUN), with JUN induction (+JUN), and after bleomycin injection. Black scale bar: 500 μm. White scale bar: 75 μm. D, dermis; ST, subcutaneous tissue. (B) Corresponding quantification of dermal thickness, fat layer thickness, fat/skin thickness relationship, fibrotic areas, total CD31+ endothelial cells and dermal p-JUN+ cells/field of view. Tukey’s multiple comparison test. *P < 0.05; **P < 0.01; ***P < 0.001. n = 4–8. Bars represent means with standard deviations.

