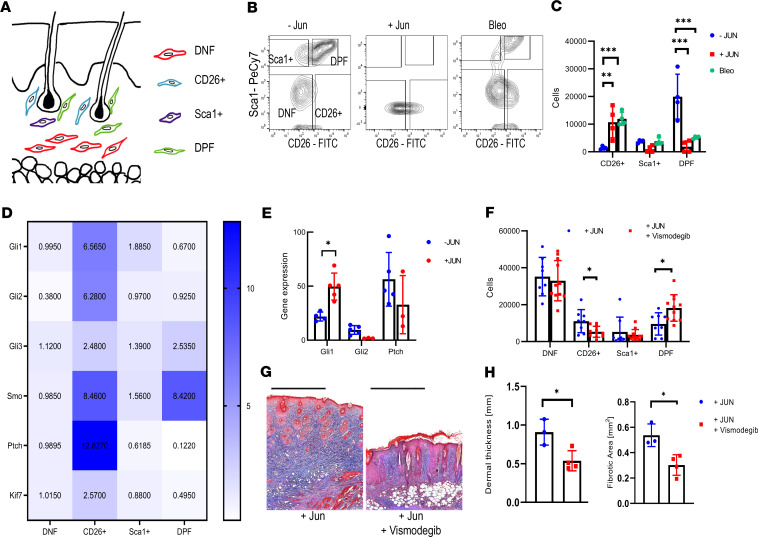
Figure 4. JUN expands distinct fibroblast populations in a hedgehog-dependent manner.
(A) Schematic drawing of the localization of double-positive fibroblasts (DPF), CD26+ fibroblasts, Sca1+ fibroblasts, and double-negative fibroblasts (DNF). (B) Representative fibroblast FACS plots without JUN induction, with JUN induction, and after bleomycin injection. (C) Corresponding quantification of total CD26+ fibroblasts, Sca1+ fibroblasts, and DPF. Tukey’s multiple comparison test. **P < 0.01; ***P < 0.001. n = 4. Bars represent means with standard deviations. (D) Heatmap of the expression of different hedgehog-associated genes in the different fibroblast populations. Values are normalized to the expression in DNF. n = 3–6. (E) Expression of Gli1, Gl2, and Ptch after JUN induction. All values are compared with the same standard value. Two-sided t test. *P < 0.05. n = 3–6. Bars represent means with standard deviations. (F) Fibroblast populations after 3 days of Jun induction ± hedgehog inhibition. Indicated are total cells/100,000 live cells. Fisher’s multiple comparison test. *P < 0.05. n = 8–11. Bars represent means with standard deviations. (G) Representative trichrome stainings after intradermal JUN induction ± hedgehog inhibition. Scale bar: 500 μm. (H) Corresponding quantification of dermal thickness and fibrotic area. Two-sided t test. *P < 0.05. n = 3. Bars represent means with standard deviations.

