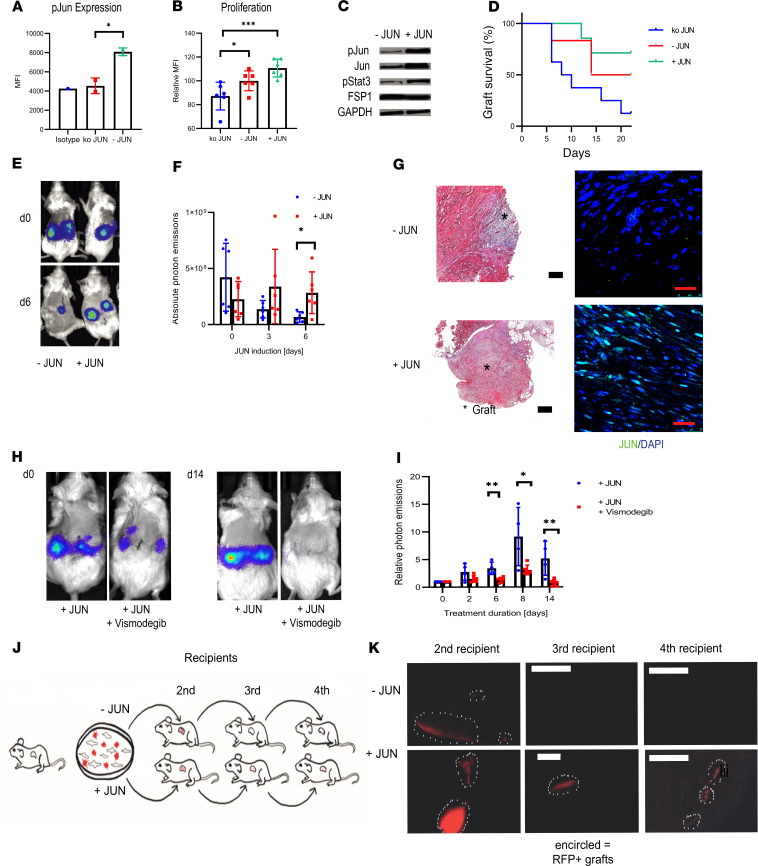
Figure 5. JUN mediates increased self-renewal to fibroblasts.
(A) Mean fluorescence intensity for p-JUN after JUN knockout (ko JUN). Tukey’s multiple comparison test. *P < 0.05. n = 2. Bars represent means with standard deviations. (B) Mean fluorescence intensity for incorporated EdU (Alexa Fluor 594) after JUN knockout, without JUN induction (- JUN) and under JUN induction (+ JUN). Tukey’s multiple comparison test. *P < 0.05; ***P < 0.001. n = 6. Bars represent means with standard deviations. (C) Western blot bands for p-JUN, p-Stat3, FSP1, and GAPDH without and with JUN induction in primary mouse dermal fibroblasts. (D) Kaplan-Meier curve of adaptive transfer graft survivals with JUN induction, without JUN induction, and after JUN knockout. Photon emissions below 100,000 were considered as representing a lost graft. n = 5–8. (E) Representative optical images of an adaptive transfer model with JUN-inducible fibroblasts. n = 4–6. (F) Quantification of absolute photon emissions with and without JUN induction. Fisher’s multiple comparison test. *P < 0.01. n = 4–6. Bars represent means with standard deviations. (G) Corresponding trichrome (original magnification, ×10) and p-JUN stains of grafts. Black scale bar: 200 μm. Red scale bar: 25 μm. n = 4–6. (H) Representative optical images of a JUN-inducible adaptive transfer model ± vismodegib. n = 4–6. (I) Corresponding quantification of photon emissions. Values were normalized to the expression at day 0. Fisher’s multiple comparison test. *P < 0.05; **P < 0.01. n = 4–6. Bars represent means with standard deviations. (J) Schema of the adaptive serial transplantation model. (K) Corresponding pictures of RFP+ cells in the second, third, and fourth recipients with and without JUN induction. Scale bar: 500 μm. n = 2.

