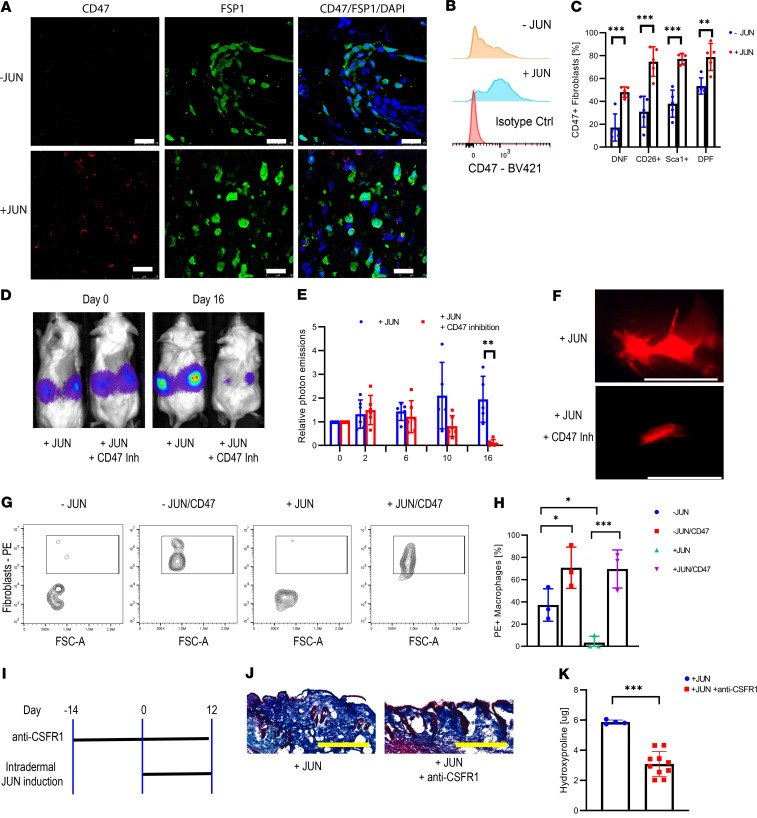
Figure 6. CD47 inhibition eliminates dermal fibroblasts in vivo and in vitro.
(A) Immunofluorescence stains against CD47 and FSP1 with and without JUN induction. Scale bar: 25 μm. n = 5. (B) Histogram of CD47 expression in fibroblasts with and without JUN induction. n = 5. (C) Percentage of CD47 positivity in different fibroblast populations with and without JUN induction. Fisher’s multiple comparison test. **P < 0.01; ***P < 0.01. n = 5. Bars represent means with standard deviations. (D) Representative optical images of ectopically transplanted JUN-inducible mouse dermal fibroblasts ± CD47 inhibition. n = 4. (E) Corresponding quantification of photon emissions. Values are normalized to day 0. Fisher’s multiple comparison test. **P < 0.01. n = 4. Bars represent means with standard deviations. (F) Fluorescent graft visualization under the dissection microscope after 7 days of CD47 inhibition. Scale bar: 5 mm. n = 2. (G) FACS plot for PE/RFP+CD11b+ macrophages ± JUN induction ± CD47 inhibition in an in vitro phagocytosis assay. n = 3. (H) Corresponding quantification of RFP+ macrophages. Tukey’s multiple comparison test. *P < 0.05; ***P < 0.01. n = 3. Bars represent means with standard deviations. (I) Schema of a macrophage depletion trial with subsequent skin fibrosis induction. n = 5. (J) Corresponding trichrome stains. Scale bar: 500 μm. n = 5. (K) Corresponding hydroxyproline assay. Two-sided t test. ***P < 0.001. n = 5. Bars represent means with standard deviations.

