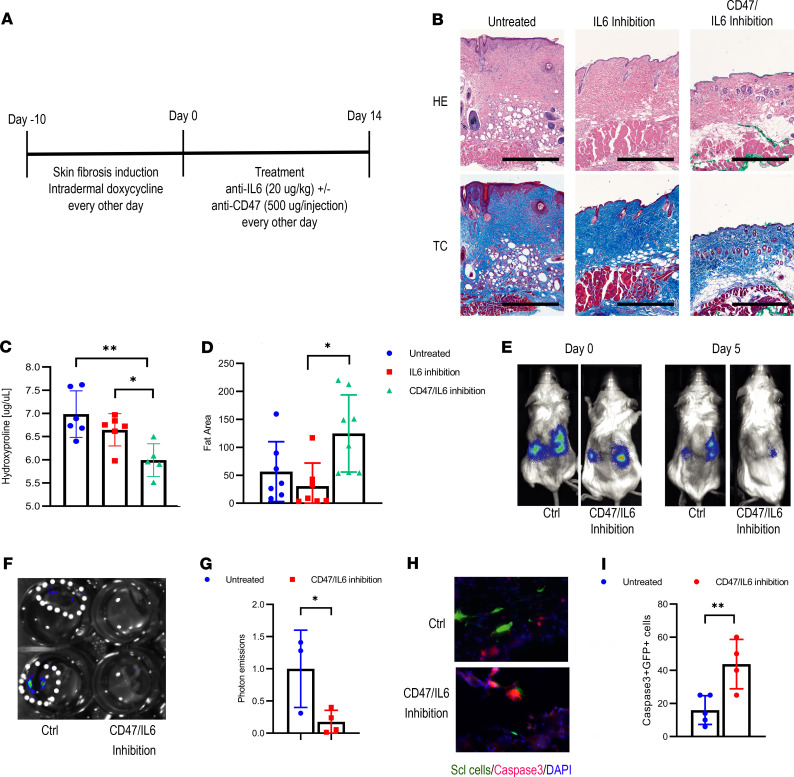
Figure 7. Combined CD47/IL-6 inhibition reverses skin fibrosis.
(A) Schematic outline of the therapeutic trial. (B) Representative H&E and trichrome stains of the different groups. Scale bar: 500 μm. n = 4. (C) Hydroxyproline content of the skin. Tukey’s multiple comparison test. *P < 0.05; **P < 0.01. n = 6. Graph bars represent means with standard deviations. (D) Amount of fat tissue. Values indicate μm2/μm skin width. Tukey’s multiple comparison test. *P < 0.05. n = 8. Graph bars represent means with standard deviations. (E) Representative optical images of ectopically transplanted GFP/luciferase-labeled human scleroderma fibroblasts ± CD47/IL-6 inhibition. (F) Optical imaging of explanted kidneys on day 5. (G) Quantification of photon emissions of explanted kidney grafts normalized to the values of the untreated mice. Two-sided t test. *P < 0.05. n = 3–4. Bars represent means with standard deviations. (H) Corresponding caspase-3 staining of kidney grafts. Scale bar: 25 μm. (I) Corresponding percentage of caspase-3+GFP+ fibroblasts. Two-sided t test. **P < 0.01. n = 4–5. Bars represent means with standard deviations.

