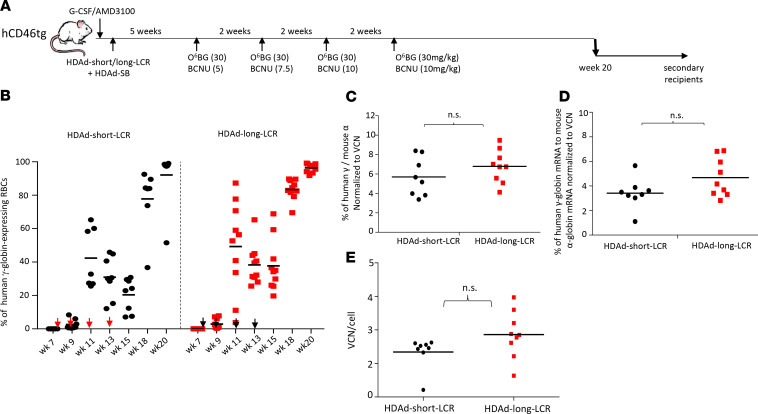
Figure 2. In vivo HSPC transduction with HDAd-long-LCR containing the 32.4 kb transposon and HDAd-short-LCR containing an 11.8 kb transposon.
(A) Treatment regimen: hCD46tg mice were mobilized and IV injected with either HDAd-short-LCR + HDAd-SB or HDAd-long-LCR +HDAd-SB (2 times each 4 × 10¹⁰ viral particles (vp) of a 1:1 mixture of both viruses). Five weeks later, O6BG/BCNU treatment was started. With each cycle, the BCNU concentration was increased from 5 mg/kg, to 7.5 mg/kg, and to 10 mg/kg. The O6BG concentration was 30 mg/kg in all 4 treatments. Mice were followed until week 20, when animals were sacrificed for analysis. Bone marrow Lin– cells were used for transplantation into secondary recipients. Secondary recipients were then followed for 16 weeks. (B) Percentage of human γ-globin–positive cells in peripheral red blood cells (RBCs) measured by flow cytometry. Each symbol is an individual animal. In mice that were mock transduced, fewer than 0.1% of cells were γ-globin–positive. The arrows indicate O6BG/BCNU treatment. (C) Levels of γ-globin protein chain measured by HPLC in RBCs at week 20 after in vivo HSPC transduction. Shown are the percentages of human γ-globin to mouse α-globin protein chains. (D) Levels of γ-globin mRNA measured by quantitative reverse transcription (qRT-PCR) in total blood at week 20 after in vivo HSPC transduction. Shown are the percentages of human γ-globin mRNA to mouse α-globin mRNA. (E) VCN per cell in bone marrow MNCs, harvested at week 20 after in vivo HSPC transduction. The difference between the 2 groups is not significant. Statistical analyses were performed using 2-way ANOVA.

