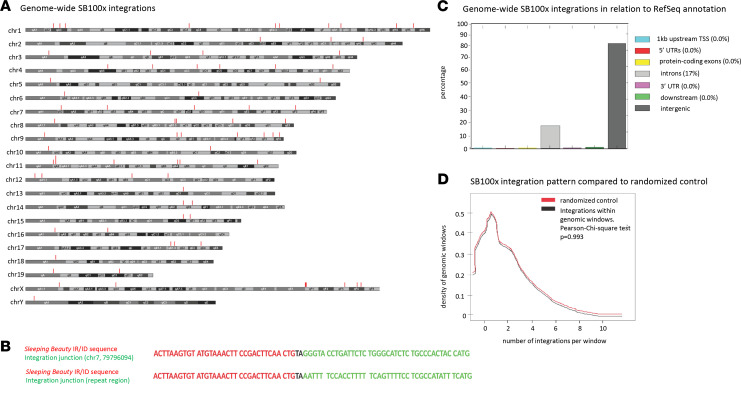
Figure 3. Analysis of vector integration sites in HSPCs by LAM-PCR/next-generation sequencing.
Genomic DNA was isolated from bone marrow cells harvested at week 20 after in vivo transduction with HDAd-long-LCR + HDAd-SB. (A) Chromosomal distribution of integration sites. The integration sites are marked by vertical red lines. (B) Examples for junction sequences. IR/DR sequences are in red. The chromosomal sequence is in green. The TA dinucleotides used by SB100x at the junction of the IR and chromosomal DNA are highlighted. (C) Integration sites were mapped to the mouse genome, and their location with respect to genes was analyzed. Shown is the percentage of integration events that occurred 1 kb upstream transcription start sites, 3′UTR of exons, protein coding sequences, introns, 3′UTRs, 1 kb downstream from 3′UTR, and intergenic. (D) Integration pattern in mouse genomic windows. The number of integrations overlapping with continuous genomic windows and randomized mouse genomic windows and size was compared. This shows that the pattern of integration is similar in continuous and random windows. Maximum number of integrations in any given window was not more than 3, with 1 integration per window having the higher incidence.

