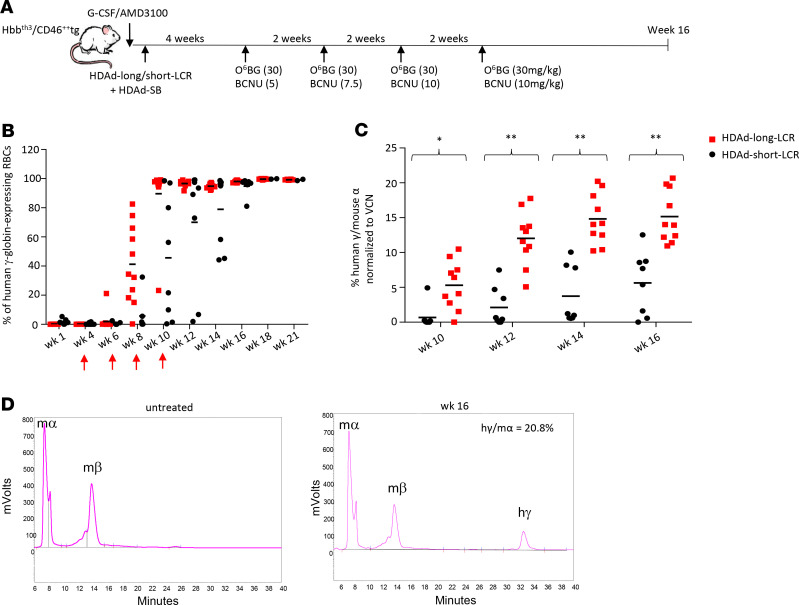
Figure 5. Human γ-globin expression after in vivo HSPC gene therapy of Hbbth3 CD46+/+ mice with HDAd-short-LCR and HDAd-long-LCR.
(A) Treatment regimen: In contrast to the study shown in Figure 2, this study was done with thalassemic Hbbth3 CD46 mice. (B) Percentage of human γ-globin–positive cells in peripheral RBCs measured by flow cytometry. Each symbol is an individual animal. The arrows indicate O6BG/BCNU treatment. (C) γ-Globin protein chain levels measured by HPLC in RBCs at weeks 10 to 16 after in vivo HSPC transduction. Shown are the percentages of human γ-globin to mouse α-globin protein chains. (D) Representative chromatograms of an untreated Hbbth3 CD46+/+ mouse (left panel) and a mouse at week 16 after treatment. Mouse α- and β-chains as well the added human γ-globin are indicated. Notably, 2 independent studies were performed with Hbbth3 CD46+/+ mice. First study: N = 6 for HDAd-long-LCR and N = 2 for HDAd-short-LCR followed for 21 weeks. Second study: N = 4 for HDAd-long-LCR and N = 5 for HDAd-short-LCR followed for 16 weeks. Figure 5B shows the combined data until week 21. All remaining figures show the combined data until week 16. Statistical analyses were performed using 2-way ANOVA. *P < 0.05; **P < 0.0001.

