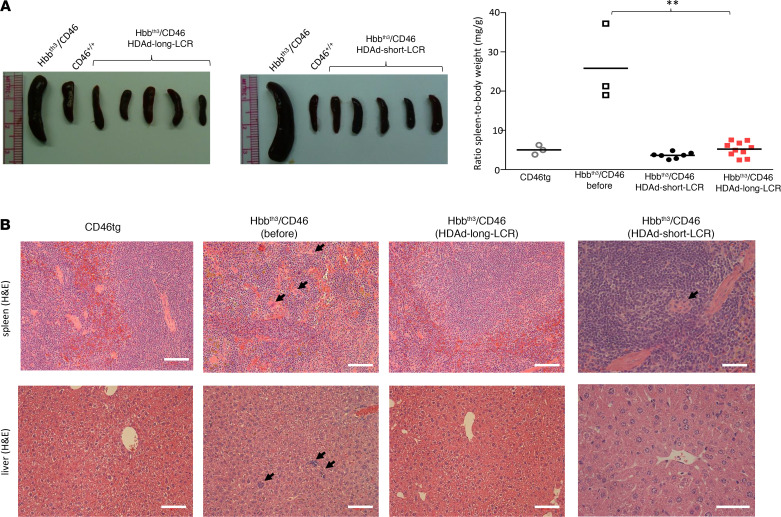
Figure 8. Phenotypic correction of extramedullary hematopoiesis in spleen and liver.
(A) Spleen size at sacrifice (week 16). Left panel: representative spleen images. Right panel: summary. Each symbol represents an individual animal. Statistical analysis was performed using 1-way ANOVA. **P < 0.0001. The difference between the 2 vectors is not significant. (B) Extramedullary hemopoiesis by H&E staining in liver and spleen sections. Clusters of erythroblasts in the liver and megakaryocytes in the spleen of Hbbth3 CD46+/+ mice are indicated by black arrows. Scale bars: 20 μm. Representative images are shown.

