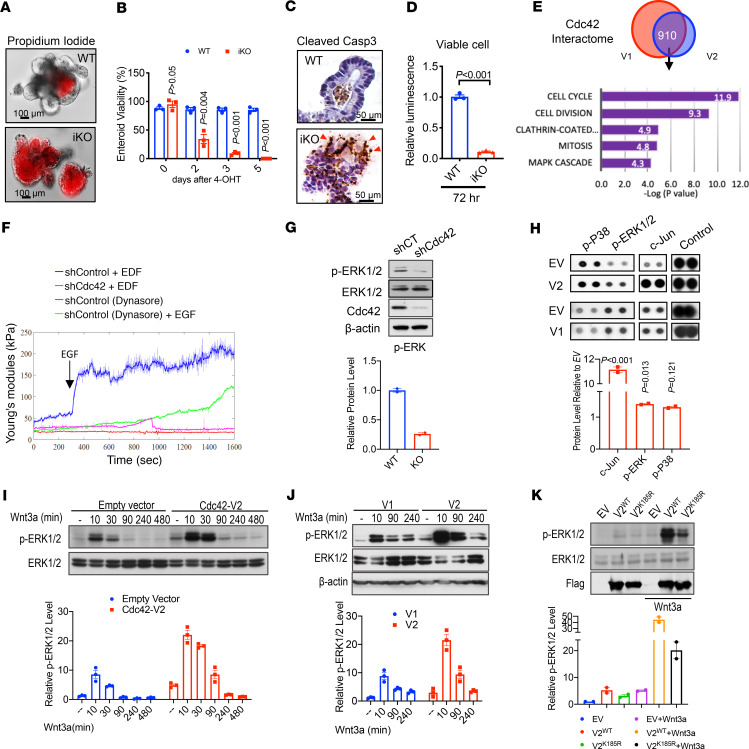
Figure 1. Enteroid survival requires Cdc42 for EGF/MAPK signaling.
(A) Propidium iodide staining (red) showed massive cell death 72 hours after 4-OHT treatment of WT and Cdc42iKO enteroids. (B) After 4-OHT treatment of enteroids, viable enteroids were counted at days 2, 3, and 5 following treatment. Data represent 3 independent experiments, each containing 2 replicates per genotype. (C) WT and Cdc42iKO enteroid sections were stained for cleaved caspase-3 to detect apoptotic cells. Images shown represent 72 hours after treatment. (D) 3D-Glo luminescence assays were used to quantify cell viability in WT and Cdc42iKO enteroids 72 hours after 4-OHT treatment. Data represent 2 independent experiments, each containing 2 replicates per genotype. (E) HEK293 cells were transfected with Flag-tagged Cdc42-V1 or -V2. Mass spectrometry analysis of Flag-Cdc42 immunoprecipitates identified a variant-specific interactome. Venn diagram reveals 910 shared interactors. Functional annotation showed the top 5 most enriched clusters ranked by P value by DAVID Gene Functional Classification Tool. (F) Serum-starved Caco2 control and Cdc42-knockdown cells were analyzed by atomic force microscope. EGF was added to cells 300 seconds after recording of each sample. Young’s modulus (kPa) indicated EGF-induced nanomechanical changes on control Caco2 cell surface, with diminished responses in control cells preincubated with dynasore or in Cdc42-knockdown cells. Graphs represent 4 independent experiments. (G) Western blots for p-ERK1/2 were performed for control and stable Cdc42-knockdown Caco2 cells cultured in regular medium with no treatment. Data were quantified from 2 independent experiments. (H) Phospho-kinase array was used to search for functional pathways downstream of Cdc42. Among 43 kinase targets, overexpressing Cdc42 in HEK293 cells increased levels of p-ERK1/2, p38, and c-Jun, especially in V2-expressing cells compared with empty vector controls. Graph represents mean values from 2 replicates. (I) Western blots were used to determine change of p-ERK1/2 in serum-starved control and Cdc42-V2 expressing cells, following the addition of Wnt3a (100 ng/mL), in time course experiments. (J) Western blots for p-ERK1/2 were used to compare V1 versus V2’s MAPK-activating capabilities. (K) Mutant Cdc42-V2K185R showed a reduced MAPK-activating capability compared with WT Cdc42-V2. Data were quantified from 2 independent experiments in I, J, and K. Please also see Supplemental Figure 1.

