
Fig. 1. Neutron total scattering data collected from disordered MgAl2O4.
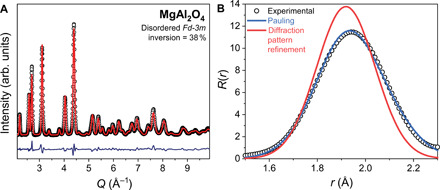
(A) Experimental neutron diffraction pattern (black circles) of MgAl2O4 modeled with the disordered spinel structure (red line). (B) Experimental pair distribution function (PDF; black circles) of MgAl2O4 compared with a simulated PDF calculated from the model refined from the diffraction pattern (red) and one simulated directly from application of Pauling’s first rule (blue) with Shannon’s ionic radii.