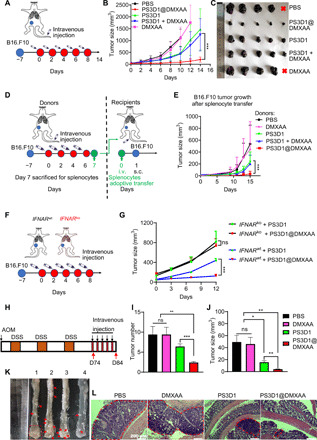
Fig. 3. PS3D1@DMXAA has therapeutic effects in different murine tumor models.

(A) Intravenous treatment scheme for mice with established B16.F10 tumor. (B) Tumor growths are shown [n = 5, data are means ± SD, two-way analysis of variance (ANOVA)]. (C) Ex vivo tumor images represented from each treatment group on day 14. (D and E) Intravenous (i.v.) treatment scheme for mice with established B16.F10 tumors. Mice with 50-mm3 subcutaneous (s.c.) tumors were administered with different treatments intravenously for four times, 2 days apart, and sacrificed on day 7 for the splenocytes. Five million of splenocytes from each group were transferred to naïve mice (n = 5) followed by challenging with B16.F10 cells, and tumor growths were monitored (E) (data are means ± SD). (F) Treatment scheme for IFNARwt and IFNARko mice with established B16.F10 tumors. Mice were intravenously treated with PS3D1@DMXAA or PS3D1 for five times, 2 days apart. (G) Tumor growths of different groups are shown (n = 4 mice per group). (H) Schematic representation of AOM/DSS-induced colitis-associated colon cancer mouse model. Mice were intravenously treated with PBS (1), free DMXAA (2), PS3D1 (3), or PS3D1@DMXAA (4) on day 74 for five times, 2 days apart. The mice were sacrificed on day 84 for tumor growth analysis. (I to L) Representative images of tumors (I, red arrows), the number (J) and size (K) of colon tumors, and hematoxylin and eosin (H&E) staining (L) of representative tumors from each group (n = 5). Data are means ± SEM unless otherwise indicated. Statistical significance was calculated by two-tailed Student’s t test. ***P < 0.001, **P < 0.01, and *P < 0.05. Scale bars, 200 μm. Photo credits for (C) and (K): Jingjing Liang, Department of Radiology, Sir Run Run Shaw Hospital, Zhejiang University School of Medicine.
