
Fig. 2. Aac2 oligomerization is conformation sensitive.
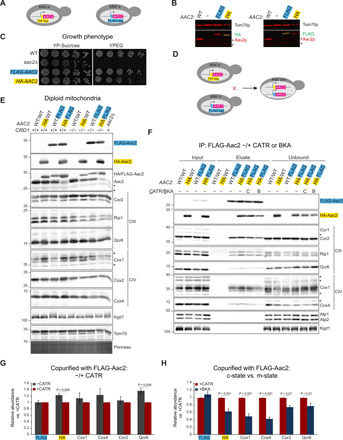
(A) Schematic representation of yeast strains expressing endogenously tagged Aac2. (B) Fluorescent immunoblots of whole-cell extracts from indicated haploid yeast strains for Aac2 (red) and either the HA or FLAG epitopes (green); Tom70 served as loading control. *, nonspecific bands (n = 3). (C) Serial dilutions of haploid cells from indicated strains were spotted onto YP medium supplemented with sucrose YP-Sucrose or ethanol-glycerol (YPEG) and incubated at 30°C for 3 days (n = 3). (D) Mating strategy to establish diploid yeast expressing two different endogenously tagged forms of Aac2. (E) Diploid mitochondria (20 μg) were resolved by 10 to 16% SDS-PAGE and immunoblotted as indicated. The migration of epitope-tagged and WT Aac2, which were codetected with an Aac2 polyclonal antisera, is indicated. *, nonspecific bands. Bottom panel shows Ponceau S–stained membrane (n = 3). (F) Mitochondria (250 μg) from the indicated CL-producing strains, preincubated with CATR (40 μM) or BKA (10 μM) as listed, were solubilized with 1.5% (w/v) digitonin and FLAG-Aac2 immunoprecipitated (IP) using anti-FLAG resin. The presence of copurified HA-Aac2 and subunits of complexes III (Cor1, Cor2, Rip1, and Qcr6) and IV (Cox1 and Cox4) was determined by immunoblotting; Atp1, Atp2, and Kgd1 served as controls. *, nonspecific bands. Four percent of input (mitochondria) and unbound (flow through following FLAG immunoprecipitation) was analyzed (n = 4). (G) The amount of HA-Aac2 and respiratory complex subunits coimmunoprecipitated with FLAG-Aac2 in untreated mitochondria was determined relative to mitochondria preincubated with CATR (means ± SEM for n = 4 independent experiments). (H) The amount of HA-Aac2 and respiratory complex subunits coimmunoprecipitated with FLAG-Aac2 in BKA pretreated mitochondria was determined relative to mitochondria preincubated with CATR (means ± SEM for n = 8 independent experiments). Statistical differences for (G) and (H) were determined by Mann-Whitney rank sum test.