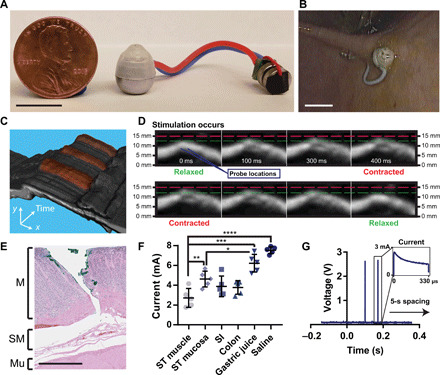
Fig. 4. In vivo electrical stimulation of the gut.

(A) STIMS system connected to two 1.55-V silver oxide coin cell batteries and a microcontroller. Before ingestion, electronics were coated in PDMS. Photo credit: Alex Abramson, MIT. (B) In vivo release and tissue localization of the STIMS. Photo credit: Joy Collins, MIT. (C) Stacked 2D and (D) sequential ultrasound images over time of muscular stimulation from electrical probes in in vivo swine stomachs. In (C), artificially colored red areas denote contraction events. MATLAB was used to isolate the muscle section from the rest of the image. A video is included in the supplement. Photo credit: Joy Collins, MIT. (E) Histology from ex vivo swine tissue injected by STIMS with hooked needles using a 5-N spring. Needles inserted through the mucosal layer of the stomach without perforating the tissue (M, mucosa; SM, submucosa; Mu, outer muscle). Photo credit: Kathleen Cormier, MIT. (F) Maximum current measured through a circuit connected in series with an in vivo swine stomach using a 2.5-V microcontroller (n = 5). ST, stomach; SI, small intestine. (G) Microcontroller stimulation events in vivo measured via an oscilloscope (n = 15). Scale bars, 1 cm (A and B) and 1 mm (E). Means ± SD; *P < 0.05; **P < 0.01; ***P < 0.001; ****P < 0.0001.
