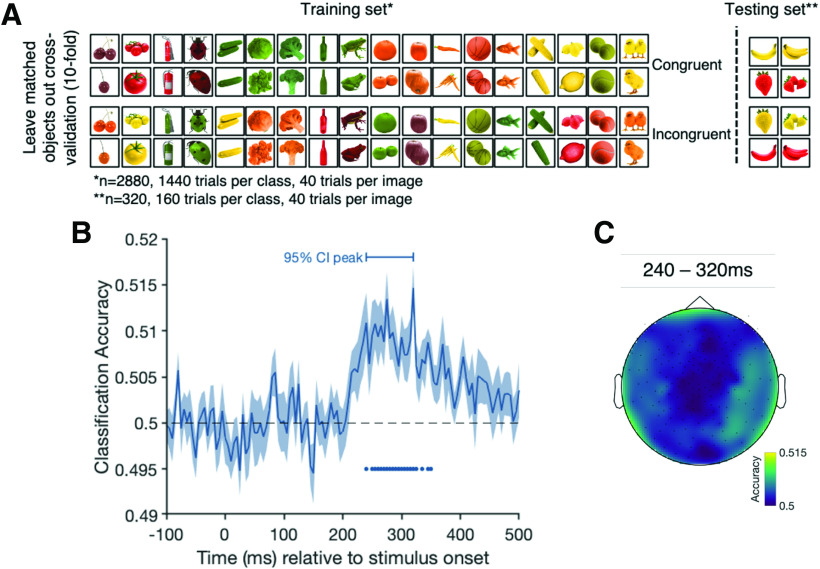
Figure 2.
Cross-validation and results of the congruency analysis contrasting trials from the congruent and incongruent conditions. A, The leave-one-matched-exemplar-out cross-validation approach for a single fold for the congruency decoding analysis. The classifier was trained on the trials shown on the left and tested on the trials on the right, ensuring that the classifier is not tested on the exemplars on which it trained. This limits the effect features other than congruency can have on classifier performance. B, The classification accuracy over time. Shading represents the SE across participants. Black dashed line indicates chance level (50%, congruent vs incongruent). Filled dots indicate significant time points, corrected for multiple comparisons. Horizontal bar above the curve represents the 95% CI of the peak. C, An exploratory sensor searchlight analysis in which we run the same analysis across small clusters of sensors. Colors represent the decoding accuracy for each sensor cluster averaged over the 95% CI of the peak time points.

