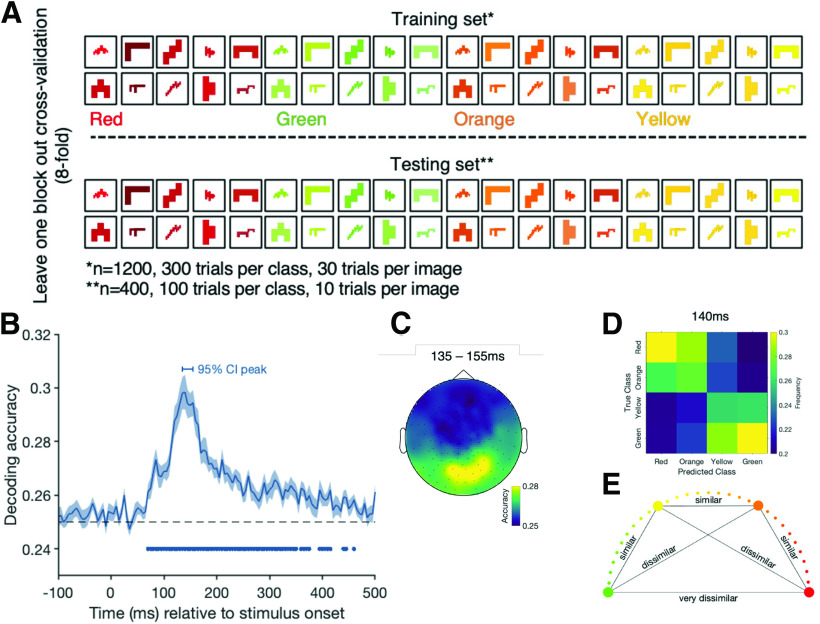
Figure 3.
A, The color decoding analysis when training the classifier to distinguish between the different color categories of the abstract shapes and testing on a block of independent abstract shape trials. B, The decoding accuracy for the color decoding analysis over time. Shading represents the SE across participants. Black dashed line indicates chance level (25%, red vs green vs orange vs yellow). Filled dots indicate significant time points, corrected for multiple comparisons. Horizontal bar above the curve represents the 95% CI of the peak. C, The results of an exploratory searchlight analysis over small sensor clusters averaged across the time points of the 95% CI for peak decoding. Colors represent the decoding accuracies at each sensor. D, A confusion matrix for peak decoding (140 ms) showing the frequencies at which color categories were predicted given the true class. E, The similarity of the color categories, which might underlie the results in D.

