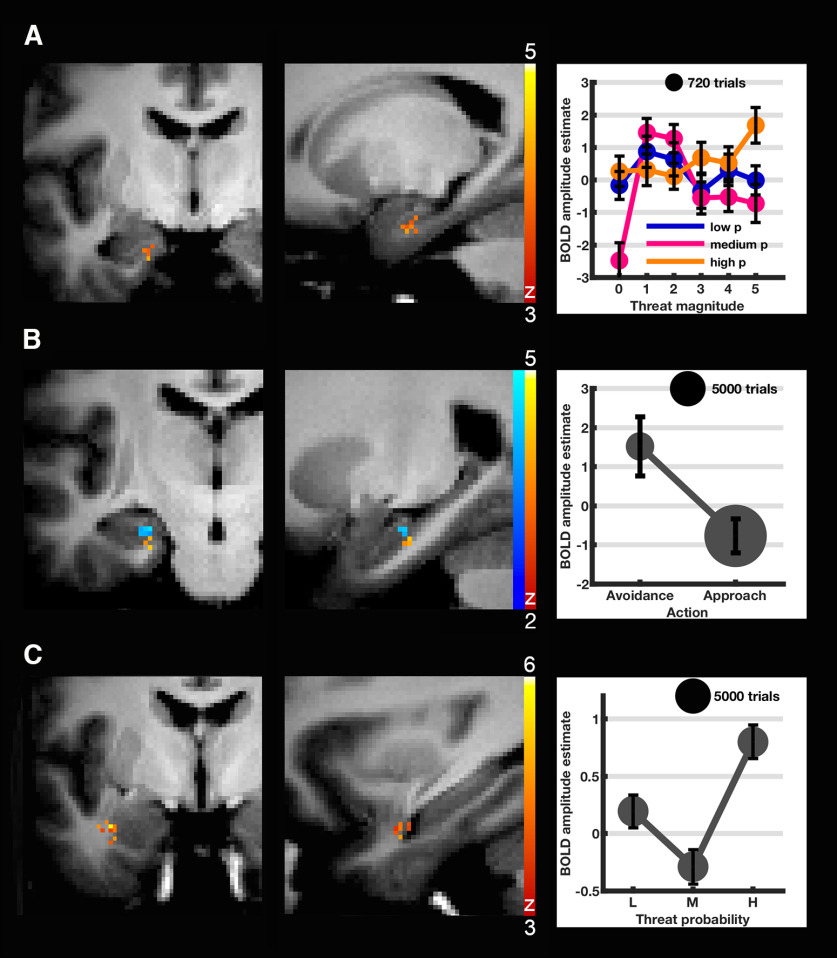
Figure 3.
Cluster-level significant aHC and amygdala clusters from parametric analysis with, for purposes of illustration, extracted estimated condition × condition BOLD response ± SEM as defined by SD of BOLD response amplitude estimates divided by square root of number of data points. Red represents primary analysis clusters using 8 mm FWHM smoothing kernel. Blue represents secondary analysis cluster (B) using 4 mm kernel. A, Left anterior subiculum-entorhinal cortex cluster modulated by combined threat probability and magnitude (linear-positive interaction effect, analysis P1). B, Left anterior subiculum-entorhinal cortex area relating to avoidance (P2; small-volume corrected). Secondary analysis localized this cluster to the left anterior CA3/dentate gyrus area. BOLD estimates ± SEM are displayed for the 4 mm cluster. C, Left lateral amygdala cluster quadratically modulated by threat probability (P1). All results are FEW-corrected at cluster level (p < 0.05; voxel inclusion threshold: p < 0.001).

