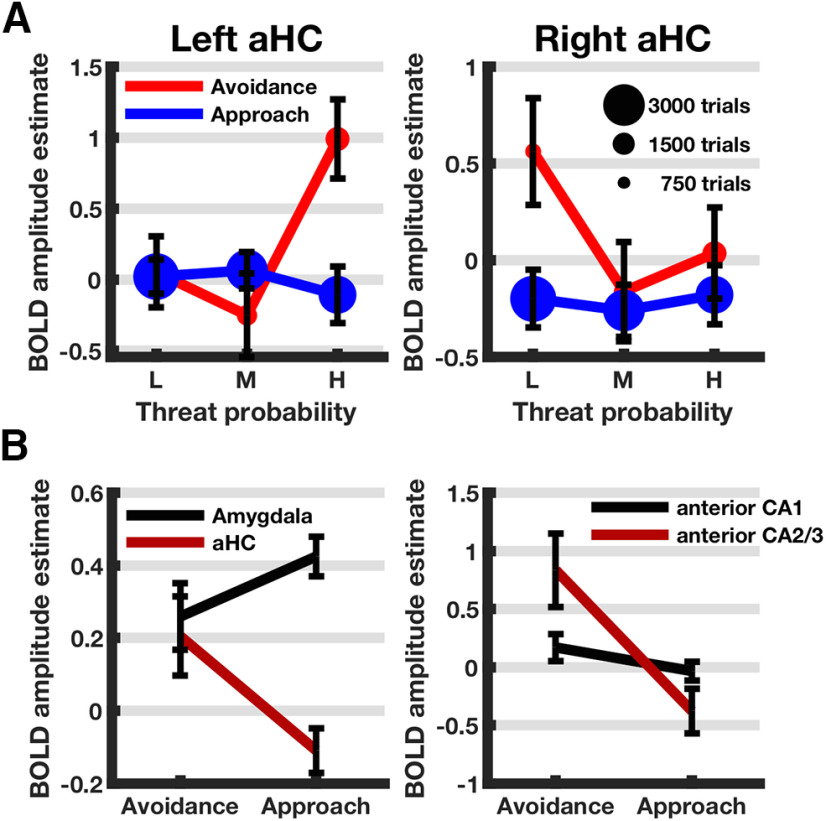
Figure 4.
ROI analyses for aHC (A), amygdala versus aHC (B), and anterior CA1 versus anterior CA2/3 (B). A, Interaction effect of threat probability, approach, and hemisphere: that is, estimated condition × condition BOLD response amplitudes ± SEM defined as SD of mixed-effects model residuals divided by square root of number of data points. B, Interaction effect of behavior × ROI for amygdala versus aHC and anterior CA1 versus anterior CA2/3 (condition × condition BOLD response ± SEM).

